TL;DR: In late Aug–Sep 2025, Bitnami (Broadcom) shifted most free images off docker.io/bitnami, introduced a latest-only, dev-intended “bitnamisecure” subset, archived versioned tags to docker.io/bitnamilegacy (no updates), ran rolling brownouts of popular images, and said their OCI Helm charts on Docker Hub would stop receiving updates (except for the tiny free subset). Result: lots of teams saw pull failures and surprise drift, especially for core bits like kubectl, ExternalDNS, PostgreSQL; some Helm charts still referenced images that went missing mid-migration. GitHub+2hub.docker.com+2
What changed (and when)
Timeline. Bitnami announced the change for 28 Aug 2025, then postponed deletion of the public catalog to 29 Sep 2025, running three 24-hour brownouts to “raise awareness.” Brownout sets explicitly included external-dns (Aug 28) and kubectl, redis, postgresql, mongodb (Sep 17). Tags were later restored, except very old distro bases. GitHub
Free tier becomes “bitnamisecure/…” Available only as latest and “intended for development” (their wording). No version matrix. hub.docker.com+1
Legacy archive. Versioned tags moved to docker.io/bitnamilegacy—no updates, no support; meant only as a temporary bridge. GitHub+1
Charts. Source code stays on GitHub, but OCI charts on Docker Hub stop receiving updates (except the small free subset) and won’t work out-of-the-box unless you override image repos. Bitnami’s own FAQ shows helm upgrade … --set image.repository=bitnamilegacy/... as a short-term band-aid. GitHub
That mix of latest-only + brownouts + chart defaults still pointing at moved/blocked images is why so many clusters copped it, bru—especially anything depending on kubectl sidecars/hooks, ExternalDNS, or PostgreSQL images. GitHub
Why “latest-only, dev-intended” breaks production hygiene
Production needs immutability and pinning. “Latest” is mutable and can introduce breaking changes or CVE regressions without your staging gates ever seeing them. Bitnami explicitly positions these bitnamisecure/* freebies as development-only; if you need versions, you’re pointed to a paid catalog. That alone makes the free images not fit for prod, regardless of hardening claims. hub.docker.com
How clusters actually broke
Brownouts removed popular images for 24h windows. If your charts/Jobs still pulled from docker.io/bitnami, pods simply couldn’t pull. Next reconciliation loop? CrashLoop/back-off. GitHub
Chart/image mismatch. OCI charts remain published but aren’t updated to point at the new repos; unless you override every image.repository (and sometimes initContainer/metrics sidecars), you deploy a chart that references unavailable images. Bitnami’s own example shows how many fields you might need to override in something like PostgreSQL. GitHub
kubectl images. Lots of ops charts use a tiny kubectl image for hooks or jobs. When bitnami/kubectl went dark during brownouts, those jobs failed. Upstream alternatives exist (see below). hub.docker.com+1
Better defaults for core components (ditch the vendor lock)
Wherever possible, move back upstream for the chart and use official/community images:
Velero – Upstream chart (VMware Tanzu Helm repo on Artifact Hub) and upstream images (pin). artifacthub.io
kubectl – Prefer upstream registry: registry.k8s.io hosts Kubernetes container images; several maintained images provide kubectl (or use distro images like alpine/kubectl/rancher/kubectl if they meet your standards—pin exact versions). GitHub+3Kubernetes+3GitHub+3
For stateful services:
PostgreSQL – Operators such as CloudNativePG (CNCF project). Alternatives include commercial operators; or, if you stick with straight images, use the official postgres image and manage via your own Helm/Kustomize. cloudnative-pg.io+1
MongoDB – Percona Operator for MongoDB (open-source) is a strong, widely used option. Percona Documentation+1
Redis – Consider the official redis image (or valkey where appropriate), plus a community operator if you need HA/cluster features; evaluate operator maturity and open issues for your SLA needs. (Context from Bitnami’s lists shows Redis/Valkey were part of the brownout sets.)
Questions Bitnami should answer publicly
Why ship a dev-only latest-only free tier for components that underpin production clusters, without a long freeze window and frictionless migration for chart defaults? (Their Docker Hub pages literally say latest-only and dev-intended.) hub.docker.com
Why brownouts of ubiquitous infra images (external-dns, kubectl, postgresql) during the migration window, increasing blast radius for unsuspecting teams? GitHub
Why leave OCI charts published but not updated to sane defaults (or at least yanking them) so new installs don’t reference unavailable registries by default?
Bitnami
Gain confidence, control and visibility of your software supply chain security with production-ready open source software delivered continuously in hardened images, with minimal CVEs and transparency you can trust.
We have lost confidence in your software supply chain.
TL;DR: Pin versions, set sane resources, respect system-node taints, make Gatekeeper happy, no-encoding secrets, and mirror images (Never pull from public registries and blindly trust them).
Works great on AKS, EKS, GKE — examples below use AKS.
The default dynakube template that Dynatrace provides you – will probably not work in the real world. You have zero trust, Calico firewalls, OPA Gatekeeper and perhaps some system pool taints?
Quick checks (healthy install):
dynatrace-operator Deployment is Ready
2x dynatrace-webhook pods
dynatrace-oneagent-csi-driver DaemonSet on every node (incl. system)
OneAgent pods per node (incl. system)
1x ActiveGate StatefulSet ready
Optional OTEL collector running if you enabled it
k get dynakube
NAME                  APIURL                                  STATUS    AGE
xxx-prd-xxxxxxxx      https://xxx.live.dynatrace.com/api   Running   13d
kubectl -n dynatrace get deploy,sts

# CSI & OneAgent on all nodes
kubectl -n dynatrace get ds

# Dynakube CR status
kubectl -n dynatrace get dynakube -o wide

# RBAC sanity for k8s monitoring
kubectl auth can-i list dynakubes.dynatrace.com \
  --as=system:serviceaccount:dynatrace:dynatrace-kubernetes-monitoring --all-namespaces

NAME                                 READY   UP-TO-DATE   AVAILABLE   AGE
deployment.apps/dynatrace-operator   1/1     1            1           232d
deployment.apps/dynatrace-webhook    2/2     2            2           13d

NAME                                                  READY   AGE
statefulset.apps/xxx-prd-xxxxxxxxxxx-activegate       1/1     13d
statefulset.apps/xxx-prd-xxxxxxxxxxx-otel-collector   1/1     13d
NAME                            DESIRED   CURRENT   READY   UP-TO-DATE   AVAILABLE   NODE SELECTOR   AGE
xxx-prd-xxxxxxxxxxx-oneagent    9         9         9       9            9           <none>          13d
dynatrace-oneagent-csi-driver   9         9         9       9            9           <none>          13d
NAME                  APIURL                                  STATUS    AGE
xxx-prd-xxxxxxxxxxx   https://xxx.live.dynatrace.com/api   Running   13d
yes
Here are field-tested tips to keep Dynatrace humming on Kubernetes without fighting OPA Gatekeeper, seccomp, or AKS quirks.
1) Start with a clean Dynakube spec (and pin your versions)
Pin your operator chart/image and treat upgrades as real change (PRs, changelog, Argo sync-waves). A lean cloudNativeFullStack baseline that plays nicely with Gatekeeper:
Why this works: it respects control-plane taints, adds the CriticalAddonsOnly toleration for system pools, sets reasonable resource bounds, and preps you for GitOps.
2) System node pools are sacred — add the toleration
If your CSI Driver or OneAgent skips system nodes, your visibility and injection can be patchy. Make sure you’ve got:
Your taints might be different, so check what taints you have on your systempools. This is the difference between “almost there” and “golden”.
3) Resource requests that won’t sandbag the cluster
OneAgent: requests: cpu 100m / mem 512Mi and limits: cpu 300m / mem 1.5Gi are a good starting point for mixed workloads.
ActiveGate: requests: 500m / 1.5Gi, limits: 1000m / 1.5Gi. Tune off SLOs and node shapes; don’t be shy to profile and trim.
4) Make Gatekeeper your mate (OPA policies that help, not hinder)
Enforce the seccomp hint on DynaKube CRs (so the operator sets profiles on init containers and your PSA/Gatekeeper policies stay green).
ConstraintTemplate (checks DynaKube annotations):
5) Secrets: avoid the dreaded encode (akv2k8s tip)
Kubernetes Secret.data is base64 on the wire, but tools like akv2k8s can also feed you values that are already base64. If using tools like akv2k8s, use this to transform the output.
This will ensure Dynatrace can read the Kubernentes Opaque secret as it, no base64 encoding on the secret.
6) Mirror images to your registry (and pin)
Air-gapping or just speeding up pulls? Mirror dynatrace-operator, activegate, dynatrace-otel-collector into your ACR/ECR/GCR and reference them via the Dynakube templates.*.imageRef blocks or Helm values. GitOps + private registry = fewer surprises.
We use ACR Cache.
7) RBAC: fix the “list dynakubes permission is missing” warning
If you see that warning in the UI, verify the service account:
kubectl auth can-i list dynakubes.dynatrace.com \ –as=system:serviceaccount:dynatrace:dynatrace-kubernetes-monitoring –all-namespaces
If “no”, ensure the chart installed/updated the ClusterRoleandClusterRoleBinding that grant list/watch/get on dynakubes.dynatrace.com. Sometimes upgrading the operator or re-syncing RBAC via Helm/Argo cleans it up.
When you install the Dynatrace Operator, you’ll see pods named something like dynatrace-webhook-xxxxx. They back one or more admission webhook configurations. In practice they do three big jobs:
Mutating Pods for OneAgent injection
Adds init containers / volume mounts / env vars so your app Pods load the OneAgent bits that come from the CSI driver.
Ensures the right binaries and libraries are available (e.g., via mounted volumes) and the process gets the proper preload/agent settings.
Respects opt-in/opt-out annotations/labels on namespaces and Pods (e.g. dynatrace.com/inject: "false" to skip a Pod).
Can also add Dynatrace metadata enrichment env/labels so the platform sees k8s context (workload, namespace, node, etc.).
Validating Dynatrace CRs (like DynaKube)
Schema and consistency checks: catches bad combinations (e.g., missing fields, wrong mode), so you don’t admit a broken config.
Helps avoid partial/failed rollouts by rejecting misconfigured specs early.
Hardening/compatibility tweaks
With certain features enabled, the mutating webhook helps ensure injected init containers comply with cluster policies (e.g., seccomp, PSA/PSS).
That’s why we recommend the annotation you’ve been using: feature.dynatrace.com/init-container-seccomp-profile: "true" It keeps Gatekeeper/PSA happy when it inspects the injected bits.
Why two dynatrace-webhook pods?
High availability for admission traffic. If one goes down, the other still serves the API server’s webhook calls.
How this ties into Gatekeeper/PSA
Gatekeeper (OPA) also uses validating admission.
The Dynatrace mutating webhook will first shape the Pod (add mounts/env/init).
Gatekeeper then validates the final Pod spec.
If you’re enforcing “must have seccomp/resources,” ensure Dynatrace’s injected init/sidecar also satisfies those rules (hence that seccomp annotation and resource limits you’ve set).
Dynatrace Active Gate
A Dynatrace ActiveGate acts as a secure proxy between Dynatrace OneAgents and Dynatrace Clusters or between Dynatrace OneAgents and other ActiveGates—those closer to the Dynatrace Cluster. It establishes Dynatrace presence—in your local network. In this way it allows you to reduce your interaction with Dynatrace to one single point—available locally. Besides convenience, this solution optimizes traffic volume, reduces the complexity of the network and cost. It also ensures the security of sealed networks.
The docs on Active Gate and version compatibility with Dynakube are not yet mature. Ensure the following:
With Dynatrace Operator 1.7 the v1beta1 and v1beta2 API versions for the DynaKube custom resource were removed.
ActiveGates up to and including version 1.323 used to call the v1beta1 endpoint. Starting from ActiveGate 1.325, the DynaKube endpoint was changed to v1beta3 Ensure your ActiveGate is up to date with the latest version.
As part of our ongoing platform reliability work, we’ve introduced explicit CPU and memory requests/limits for all Dynatrace components running on AKS.
🧩 Why it matters
Previously, the OneAgent and ActiveGate pods relied on Kubernetes’ default scheduling behaviour. This meant:
No guaranteed CPU/memory allocation → possible throttling or eviction during cluster load spikes.
Risk of noisy-neighbour effects on shared nodes.
Unpredictable autoscaling signals and Dynatrace performance fluctuations.
Setting requests and limits gives the scheduler clear boundaries:
Requests = guaranteed resources for stable operation
Limits = hard ceiling to prevent runaway usage
Helps Dynatrace collect telemetry without starving app workloads
These values were tuned from observed averages across DEV, UAT and PROD clusters. They provide a safe baseline—enough headroom for spikes while keeping node utilisation predictable.
Docker has revolutionized the way applications are developed and deployed. However, as Docker images grow in complexity, so do their sizes, which can lead to longer build times, increased storage costs, and slower deployment speeds. One way to mitigate these issues is through optimizing Dockerfiles using multi-stage builds. This blog post will explain how to optimize Dockerfiles, reduce image size, and improve security using multi-stage builds and other best practices.
Understanding Multi-Stage Builds
Multi-stage builds allow you to use multiple FROM statements in your Dockerfile. This feature enables you to create intermediate images that are not included in the final image, thereby reducing the final image size.
Best Practices for Dockerfile Optimization
1. Use Small Base Images: Start with a minimal base image like alpine to reduce the overall size.
2. Combine Commands: Use && to chain commands together to reduce the number of layers.
3. Clean Up: Remove unnecessary files and packages to keep the image clean and minimal.
4. Avoid Unnecessary Packages: Only install the packages you need.
5. Multi-Stage Builds: Use multi-stage builds to keep build dependencies out of the final image.
6. Remove SSH and Unnecessary Services: Improve security by not including SSH and other unnecessary services in your image.
Example Web Application Dockerfile (Non-Optimized)
# Stage 1: Build Stage
FROM node:16-alpine as build

# Set working directory
WORKDIR /app

# Install dependencies
COPY package*.json ./
RUN npm install

# Copy application files and build
COPY . .
RUN npm run build

# Stage 2: Runtime Stage
FROM nginx:alpine

# Remove default nginx website
RUN rm -rf /usr/share/nginx/html/*

# Copy built application from build stage
COPY --from=build /app/build /usr/share/nginx/html

# Stage 3: Install Runtime Dependencies
FROM node:16-alpine as runtime

# Set working directory
WORKDIR /app

# Copy only package.json and package-lock.json to install runtime dependencies
COPY package*.json ./
RUN npm install --production

# Copy built application from build stage
COPY --from=build /app/build /app

# Expose port
EXPOSE 80

# Start the application
CMD ["npm", "start"]

# Start nginx
CMD ["nginx", "-g", "daemon off;"]
Explanation
1. Build Stage: This stage includes all dependencies (both development and production) required to build the application.
2. Runtime Stage: This stage installs only the production dependencies to keep the final image lean and optimized.
3. Separation of Concerns: By separating the build and runtime stages, we ensure that unnecessary development dependencies are not included in the final image.
4. Nginx Configuration: The final image uses Nginx to serve the built application, ensuring a lightweight and secure setup.
Conclusion
Optimizing your Dockerfiles can significantly reduce image size, improve build times, and enhance security. By using multi-stage builds, small base images, combining commands, and cleaning up unnecessary files, you can create efficient and secure Docker images. The example provided demonstrates how to apply these best practices to a simple web application using Nginx and Node.js.
You can do the same with your dev and production environment; stage 1 can include all the dev tools for compilation, e.g. gcc, MSBuild, etc, and stage 2 can remove these dev tools that are not required at runtime.
In the ever-evolving landscape of DevOps, continuous integration and continuous deployment (CI/CD) practices have become the backbone of modern software development. Two major players in this field are GitOps-based tools like ArgoCD and traditional CI/CD push architectures like Azure DevOps and GitHub Actions. Let’s embark on an exploratory journey to compare these two approaches, highlighting their unique features and determining which might be the best fit for your development workflow.
The Contenders
ArgoCD: A GitOps tool that utilizes a pull-based deployment model, designed for Kubernetes-centric environments. It focuses on maintaining the desired state of applications and infrastructure as defined in Git repositories.
Azure DevOps & GitHub Actions: Traditional CI/CD tools that utilize a push-based model. They are versatile, supporting various deployment environments beyond Kubernetes and integrating well with a wide range of development tools and services.
Round 1: Architecture and Approach
ArgoCD: The GitOps Champion
ArgoCD follows the GitOps paradigm, where the desired state of the system is stored in Git. This approach brings several advantages:
• Consistency: By maintaining the desired state configuration in Git, ArgoCD ensures that the actual state of the cluster matches the desired state, automatically correcting any drift.
• Security: Credentials and sensitive information remain within the Kubernetes cluster, reducing the risk of exposure.
• Versioning: Git’s inherent version control allows for easy rollbacks and audits, enhancing traceability and reliability.
ArgoCD shines in Kubernetes-centric environments where maintaining state consistency and security is paramount.
Azure DevOps & GitHub Actions: The Versatile Veterans
Azure DevOps and GitHub Actions adopt a more traditional push-based model, triggering deployments based on events (e.g., code commits). They offer:
• Flexibility: These tools support a wide range of deployment environments, from cloud-native applications to traditional on-premises systems.
• Simplicity: Familiarity among engineers and widespread documentation make them easier to adopt and implement.
• Structure: Compatibility with existing repository structures allows for seamless integration without significant restructuring.
These tools are ideal for diverse environments where flexibility and ease of use are critical.
Round 2: Deployment Models
Pull-Based Deployment (ArgoCD)
ArgoCD continuously monitors the Git repository for changes. When it detects a difference between the desired state in Git and the actual state in the cluster, it pulls the changes and applies them to the cluster.
Pros:
• Enhanced Security: By keeping sensitive information within the cluster.
• Automatic Sync: Ensures that the cluster state is always in sync with the Git repository.
Cons:
• Learning Curve: Requires a deeper understanding of Kubernetes and GitOps practices.
• Initial Setup: Can be more complex to set up compared to push-based models.
In a push-based model, changes are pushed to the deployment environment when triggered by events such as code commits. The CI/CD pipeline executes and deploys the application.
Pros:
• Ease of Use: More intuitive for developers familiar with traditional CI/CD practices.
• Broad Support: Works well with various environments and tools.
Cons:
• Potential Inconsistencies: The actual state might drift from the desired state if not managed properly.
• Security Risks: Credentials might need to be managed outside the cluster.
Round 3: Integration and Ecosystem
ArgoCD
ArgoCD is tightly integrated with Kubernetes and excels in environments where Kubernetes is the primary platform. It integrates well with other cloud-native tools like Prometheus, Grafana, and various service meshes.
Azure DevOps & GitHub Actions
These tools boast a rich ecosystem with extensive integrations across various platforms and services, including cloud providers (Azure, AWS, GCP), container registries, and monitoring tools.
The Hybrid Approach: Best of Both Worlds
As highlighted in the recommendations from the Catalyst team, a hybrid approach leveraging both GitHub Actions for CI and ArgoCD for CD can offer the best of both worlds. This strategy allows teams to:
• Utilize GitHub Actions for building, testing, and initial deployment stages across diverse environments.
• Adopt ArgoCD for Kubernetes-specific deployments, ensuring state consistency and security.
Conclusion
The choice between ArgoCD and traditional CI/CD tools like Azure DevOps and GitHub Actions ultimately depends on your specific needs and environment. If your operations are Kubernetes-centric and you prioritize security and state consistency, ArgoCD is a robust choice. However, for diverse environments requiring flexibility and ease of use, Azure DevOps and GitHub Actions remain strong contenders.
By understanding the strengths and trade-offs of each approach, you can design a CI/CD pipeline that not only meets your operational requirements but also enhances the developer experience. Whether you choose ArgoCD, traditional push architectures, or a hybrid approach, the key is to align your tools with your development goals, ensuring efficient and reliable software delivery.
By following this integrated approach, you can leverage the strengths of both GitHub Actions and ArgoCD, ensuring efficient and secure CI/CD processes tailored to your needs. This strategy promotes scalability, security, and developer productivity while accommodating the diverse requirements of modern software development.
Hope you enjoyed this detailed exploration of ArgoCD vs. traditional CI/CD push architectures. Keep experimenting, stay curious, and happy deploying!
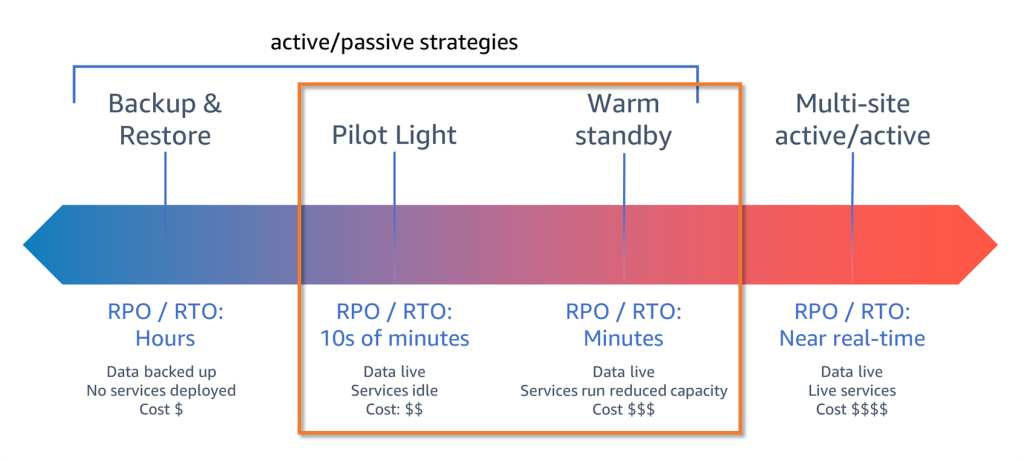
When designing a robust disaster recovery (DR) strategy in Azure, understanding zonal and regional capabilities is crucial. Here are some tips to help you optimize your architecture for resilience and reliability:
Understanding Zonal vs. Regional Redundancy
Zonal Redundancy: This involves replicating data and services across multiple availability zones within the same region. Each zone is a separate physical location with independent power, cooling, and networking, ensuring that if one zone fails, others remain operational.
Regional Redundancy: This refers to replicating resources across different geographical regions, providing an additional layer of protection. This ensures that your services remain available even in the event of a regional outage.
Easy Wins for Enhanced Resilience
Azure Site Recovery:
What It Does: Azure Site Recovery (ASR) enables business continuity by replicating workloads from a primary site to a secondary location. In case of an outage, you can failover to the secondary location and access your applications and data.
Why It’s Useful: ASR is straightforward to set up, provides automated failover and recovery, and integrates with various Azure services. It’s a cost-effective way to enhance your DR strategy without significant upfront investment.
Zonal Redundancy:
Implementation: Choose services that support zonal redundancy, such as zone-redundant storage (ZRS), to ensure data is replicated synchronously across three zones within the same region. This minimizes latency and data loss in case of a zonal failure.
Benefits: Zonal redundancy offers lower latency and higher availability for critical applications, ensuring your data is accessible across multiple zones within the same region.
Invest in Higher SKUs/Tiers:
Why Upgrade?: Paying extra for higher SKUs or tiers significantly improves the redundancy and availability of your services. For instance, choosing the Premium or Ultra tiers in Azure SQL Database or Cosmos DB provides better performance and zonal redundancy.
Return on Investment: The investment leads to substantial benefits in terms of reliability, performance, and disaster recovery capabilities, often outweighing the additional expense.
A Common Scenario: Missed Opportunities for Redundancy
A frequent oversight is companies not taking the opportunity to implement zone redundancy due to office politics or short-sightedness. A prime example is when Azure products like Azure App Service versions expire. This is an excellent time to upgrade and evaluate your architecture, allowing you to enhance redundancy while also updating your services. It’s a chance to “kill two birds with one stone,” yet many miss this opportunity due to internal resistance or focus on short-term costs rather than long-term benefits.
Additional Tips
Regular Testing: Regularly test your DR plans to ensure failover processes work seamlessly. Azure provides tools to simulate outages and assess your recovery strategy’s effectiveness.
Monitor and Optimize: Use Azure Monitor and Azure Advisor to keep track of your resources’ performance and get recommendations on optimizing costs and improving availability.
Leverage Geo-Redundant Storage (GRS): For maximum data protection, consider using GRS or Read-Access Geo-Redundant Storage (RA-GRS), which replicates data to a secondary region, providing additional safety against regional disasters.
Conclusion
Implementing a robust disaster recovery strategy in Azure involves understanding zonal and regional redundancies and leveraging Azure’s built-in tools like Azure Site Recovery. By investing in zonal redundancy and higher service tiers, you can significantly enhance your cloud architecture’s resilience, ensuring business continuity and data protection in the face of disasters.
As a leader in the platform space we strive to ensure at a minimum that we provide zonal redundancy, however, keep in mind that an IT ecosystem such as E-Commerce is only as strong as its weakest link. If a critical E-Commerce vertical is not redundant then it does not matter how much redundancy you add elsewhere, the systems will not stand up to a data centre failure.
Lastly, always be pragmatic and use Risk Management strategies such as Likelihood vs Impact matrices and look for areas that provide the highest value and balance cost/effort.
Action Items
Implement Zonal Redundancy: Ensure critical services have zone redundancy to avoid single points of failure.
Upgrade SKUs/Tiers: Evaluate existing Azure services and upgrade to higher tiers that offer better redundancy and performance.
Regular Testing of DR Plans: Schedule regular disaster recovery drills to validate the effectiveness of failover processes.
Utilize Azure Site Recovery: Set up Azure Site Recovery for automated failover and recovery of workloads.
Leverage Geo-Redundant Storage: Use GRS or RA-GRS for data that requires maximum protection against regional disasters.
Monitor Performance: Use Azure Monitor to continuously assess resource performance and availability.
Gaps
Lack of Regular Review: Many companies fail to review and update their DR strategies regularly, leading to outdated plans.
Missed Upgrade Opportunities: Organizations often overlook opportunities to enhance redundancy during product version updates or expirations.
Insufficient Testing: DR plans may not be tested thoroughly, leading to gaps in actual recovery scenarios.
Office Politics: Internal resistance or focus on short-term costs can hinder implementing effective DR solutions.
Recommendations
Take Advantage of Expirations: Use service version expirations as an opportunity to evaluate and enhance redundancy.
Promote Awareness: Educate stakeholders about the long-term benefits of investing in robust disaster recovery solutions.
Set realistic RPO and RTO goals (Recovery Point Objectives and Recovery Time Objectives)
When it comes to deploying enterprise environments in Azure, managing complexity effectively is crucial. The Microsoft Cloud Adoption Framework (CAF) for Azure advocates for using multiple state files to configure various landing zones—this helps to balance risk, manage lifecycles, and accommodate diverse team functions more effectively. The traditional challenges associated with managing multiple state files can be mitigated through what we call “code-less composition,” which is an innovative approach facilitated by Terraform.
What is Code-less Composition?
In the realm of Terraform, every state file potentially interacts with others. Traditionally, configuring these interactions required manual scripting, which could be error-prone and tedious. Code-less composition simplifies this by allowing state files’ outputs to be used as input variables for another landing zone without writing any lines of code.
This feature is particularly valuable in complex architectures where you need to manage dependencies and configurations across multiple landing zones automatically. Essentially, it allows for seamless and scalable infrastructure as code practices.
How Does It Work in Azure with Terraform?
Terraform facilitates this through a feature that reads the state file’s output from one landing zone and uses it as input for another. This process is implemented through a simple variable in the Terraform configuration, vastly simplifying the setup of complex configurations. Here’s a look at how you can utilize this in your Azure environment:
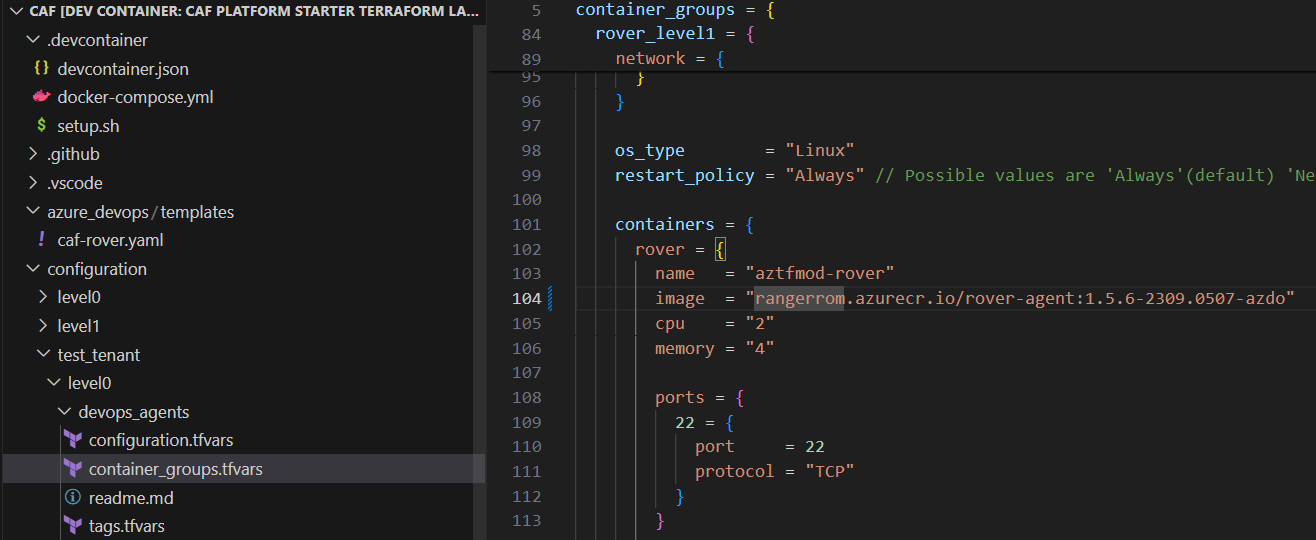
Example Configuration for a Management Landing Zone
Consider a management landing zone configured at level 1:
In this configuration, tfstates is an object where you specify the Terraform state file to load. For instance, the launchpad object loads the caf_launchpad.tfstate from a workspace (or storage container) called tfstate located one level lower. This setup indicates that any objects within this landing zone can refer to objects deployed in the same or a lower deployment level.
Referencing Resources Across Levels
For deploying resources that depend on configurations from another level, you can reference the necessary elements directly through your configurations:
This snippet showcases how to deploy an automation account within a resource group provisioned in a lower level, demonstrating the composability of the framework.
Handling External Objects
When dealing with resources that are not deployed through Terraform or are managed outside of the Azure CAF object model, you can still reference these using their resource names or IDs:
The hierarchy model of Azure CAF allows for global settings and diagnostics settings to be applied across all levels, ensuring consistent application of configurations like supported regions, naming conventions, and tag inheritance.
Conclusion
Code-less composition in Azure using Terraform represents a significant step forward in infrastructure automation. By reducing the need for manual coding, it not only minimizes human error but also speeds up the deployment process, allowing IT teams to focus more on strategic initiatives rather than getting bogged down by configuration complexities. This approach aligns with modern DevOps practices, offering a scalable, repeatable, and efficient method for managing cloud resources.
In cloud architecture and DevOps, managing secrets securely is paramount. Azure Key Vault provides a robust solution by enabling the secure storage of secrets, keys, and certificates. However, integrating Azure Key Vault with Azure DevOps through the AzureKeyVault@ task can present unique challenges, mainly when dealing with empty secrets. This blog post delves into these challenges and provides a practical workaround, which is especially useful when bootstrapping environments with Terraform.
The Challenge with Empty Secrets
When using Terraform, specifically with the Cloud Adoption Framework (CAF) Super Module, to bootstrap an environment, you might encounter a scenario where certain secrets in Azure Key Vault are intended to be empty. This could be by design, especially in dynamic environments where secret values are not immediately available or required. A typical example is the initialization of SSH keys for virtual machine scale sets (VMSS).
Note: It is impossible to have an empty secret in Keyvault if done via the portal, but who uses the Azure Portal nowadays, Flinstone?
However, when using the AzureKeyVault@ task in Azure DevOps pipelines to fetch these secrets, a peculiar behavior is observed: if a secret is empty, the task does not map it to a variable. Instead, the variable’s value defaults to the variable’s name. This behaviour can lead to unexpected results, especially when the presence or content of a secret dictates subsequent pipeline logic.
Understanding the Workaround
To effectively manage this situation, a strategic approach involves testing for valid secret values before proceeding with operations that depend on these secrets. Specifically, we employ pattern matching or regular expressions to verify that the secrets fetched from Azure Key Vault contain expected values.
Below is a simplified explanation of how to implement this workaround in an Azure DevOps pipeline:
Fetch Secrets with AzureKeyVault@ Task: Initially, use the AzureKeyVault@ task to attempt retrieving the desired secrets from Azure Key Vault, specifying the necessary parameters such as azureSubscription and KeyVaultName.
Validate Secret Values in a Bash Task: Following the retrieval, incorporate a Bash task to validate the contents of these secrets. The logic involves checking if the secret values meet predefined patterns. For SSH keys, for instance, public keys typically begin with ssh-rsa, and private keys contain BEGIN OPENSSH PRIVATE KEY.
Handle Empty or Invalid Secrets: If the secrets do not meet the expected patterns—indicative of being empty or invalid—proceed to generate new SSH key pairs and set them as pipeline variables. Furthermore, upload these newly generated keys back to Azure Key Vault for future use.
Success and Error Handling: Proceed with the intended operations upon successful validation or generation of secrets. Ensure that error handling is incorporated to manage failures, mainly when uploading keys to Azure Key Vault.
Code Implementation
Here’s a code snippet illustrating the key parts of this workaround: Note that you can access pipeline variables in three ways in Bash Scripts
For the sake of this blog post, I will demonstrate all three approaches.
steps:
  - task: AzureKeyVault@2
    inputs:
      azureSubscription: ${{ parameters.azureSubscription }}
      KeyVaultName: ${{ parameters.keyVaultName }}
      SecretsFilter: 'vmss-img-public-key, vmss-img-private-key'
  - task: Bash@3
    displayName: 'Manage SSH Key'
    inputs:
      targetType: 'inline'
      script: |
        set -e  # Exit immediately if a command exits with a non-zero status.
        set -o pipefail # Makes pipeline return the exit status of the last command in the pipe that failed
        # Check if the keys exist in the Azure Key Vault
        if [[ $VMSS_IMG_PUBLIC_KEY != ssh-rsa* ]] || [[ $VMSS_IMG_PRIVATE_KEY != *"BEGIN OPENSSH PRIVATE KEY"* ]]; then
          # Generate the SSH key pair
          ssh-keygen -t rsa -b 2048 -f "$(Build.SourcesDirectory)/sshkey" -q -N ""
          echo "SSH key pair generated."

          # Read public key and set it as a pipeline variable
          VMSS_IMG_PUBLIC_KEY=$(cat "$(Build.SourcesDirectory)/sshkey.pub")
          VMSS_IMG_PRIVATE_KEY=$(cat "$(Build.SourcesDirectory)/sshkey")
          echo "##vso[task.setvariable variable=vmss-img-public-key]$VMSS_IMG_PUBLIC_KEY"
          echo "##vso[task.setvariable variable=vmss-img-private-key]$VMSS_IMG_PRIVATE_KEY"

          # Upload the public key to Azure Key Vault
          az keyvault secret set --name vmss-img-public-key --vault-name "$KEYVAULT_NAME" --file "$(Build.SourcesDirectory)/sshkey.pub" || {
            echo "Failed to upload the public key to Azure Key Vault."
            exit 1
          }

          # Upload the private key to Azure Key Vault
          az keyvault secret set --name vmss-img-private-key --vault-name "$KEYVAULT_NAME" --file "$(Build.SourcesDirectory)/sshkey" || {
            echo "Failed to upload the private key to Azure Key Vault."
            exit 1
          }
        else
          echo "Skipping SSH Key generation, keys already present in Key Vault: $KEYVAULT_NAME"
          echo "Public Key in Keyvault $KEYVAULT_NAME is: $(vmss-img-public-key)"
        fi
    env:
      KEYVAULT_NAME: ${{ parameters.keyVaultName }}
      VMSS_IMG_PUBLIC_KEY: $(vmss-img-public-key)
      VMSS_IMG_PRIVATE_KEY: $(vmss-img-private-key)
The above script can be simplified and use better regular expressions and does not require a lot of verbose output, this is here to demonstrate different ways to access the variables vmss-img-public-key and vmss-img-private-key.
For the Bash guru’s out there, you might say, why not check for null or empty:
if [[ -z $VMSS_IMG_PUBLIC_KEY ]] || [[ -z $VMSS_IMG_PRIVATE_KEY ]]
The above will not work for variables originating from a Keyvault task where the secret is an empty string. The variable value will be the variable name and this is not a nice way to check if its empty.
There you have it. If you ever find your key vault tasks variables not being mapped to ENV automatically or accessible directly, e.g., $(vmss-img-public-key), it could be that the secret is null or empty, which can occur when using Terraform or the https://github.com/aztfmod/terraform-azurerm-caf/blob/main/dynamic_secrets.tf module.
# When called from the CAF module it can only be used to set secret values
# For that reason, object must not be set.
# This is only used here for examples to run
# the normal recommendation for dynamic keyvault secrets is to call it from a landingzone
module "dynamic_keyvault_secrets" {
  source     = "./modules/security/dynamic_keyvault_secrets"
  depends_on = [module.keyvaults]
  for_each = {
    for keyvault_key, secrets in try(var.security.dynamic_keyvault_secrets, {}) : keyvault_key => {
      for key, value in secrets : key => value
      if try(value.value, null) != null && try(value.value, null) != ""
    }
  }

  settings = each.value
  keyvault = local.combined_objects_keyvaults[local.client_config.landingzone_key][each.key]
}

output "dynamic_keyvault_secrets" {
  value = module.dynamic_keyvault_secrets
}
Why not just deploy VMSS via Terraform and have this all in the logic, you ask? Well, that’s like expecting your pet cat to fetch your slippers – it’s just not possible! VMSS and Terraform are not supported if the Orchestration Mode is Uniform ( –orchestration-mode Uniform), so we have to make do with combining the worlds of AZ CLI and Terraform to dance together like an awkward couple. Think of it as a robot tango, with lots of beeps and boops!
Optimizing Terraform’s performance, especially for plan and apply operations can involve several strategies. Here are some tips to help speed up these commands:
Parallelism Adjustment: Terraform performs operations concurrently. You can adjust the number of concurrent operations with the -parallelism flag. However, increasing this number can lead to higher memory and CPU usage. Find a balance that suits your machine or CI/CD runner specifications.
Targeted Terraform Runs: If you know exactly which resources need updating, you can use the -target option to run Terraform on specific resources. This reduces the time spent planning and applying by focusing on a subset of your resources.
Incremental Changes: Apply small, incremental changes to your infrastructure rather than large updates. Smaller changes will be quicker to plan and apply.
Module Optimization: Break down your configurations into smaller, reusable modules. This modular approach helps Terraform to process less at any given time.
State Management: Store the Terraform state in a remote backend that supports state locking and consistent reads, such as Azure Blob Storage with state locking enabled. For large infrastructures, consider breaking your configuration into smaller, independent state files to reduce read/write times.
Resource Deferment: Some resources may be inherently slow to create or update due to the nature of the service provider. If possible, manage these resources separately and apply them in different runs.
Minimize Dependencies: Avoid creating unnecessary dependencies between resources. Terraform can’t parallelize dependent resources, so the fewer interdependencies, the more it can do in parallel.
Use Provider Features: For providers like AWS, use features like depends_on to create explicit dependencies to help Terraform better plan parallelism.
Optimize Resource Usage: Check your resources’ performance on the CI/CD runner or environment where Terraform runs. Upgrading the machine or allocating more CPU/memory might be necessary if you’re consistently seeing exit codes like 137.
Refactor and Review Configurations: Over time, configurations can become inefficient or bloated. Regularly review and refactor Terraform code to simplify and remove unnecessary complexity.
Leverage Data Sources: Prefer data sources over resources for read-only operations where possible, as they can be quicker to evaluate.
Use Terraform Cloud: If you’re using open-source Terraform, consider using Terraform Cloud or Terraform Enterprise for more robust state management and operations.
Caching: Some CI/CD systems support caching between runs. If you’re running Terraform in a CI/CD pipeline, make sure to cache the .terraform directory to avoid re-downloading plugins and modules.
Avoid Unnecessary Outputs: Excessive use of outputs, especially when they contain large amounts of data, can slow down Terraform’s performance. Keep outputs to the minimum necessary.
Profile Apply Time: Use TF_LOG=TRACE for a one-off apply to see where time is being spent. Be aware this will generate a lot of logs but can be useful to spot any bottlenecks.
Lastly, upgrade your DevOps agent CPU and Memory. I ran into Terraform exit code 137 and upgraded the CPU and Memory, which helped the DevOps Agents a lot.
retVal=$? if [ $retVal -eq 137 ]; then echo "The process was killed, possibly due to a CPU or memory issue." exit $retVal elif [ $retVal -ne 1 ]; then exit 0 fi failOnStderr: true displayName: ${{ parameters.displayName }}
In the ever-evolving landscape of cloud computing, the need for automation and governance at scale has never been more critical. Microsoft Azure, a leading cloud service provider, offers many features to manage and secure cloud resources effectively. However, the real game-changer in this domain is the Cloud Adoption Framework (CAF) Enterprise Scale Rover, a tool designed to supercharge your Azure governance strategy. This blog post will delve into automating the deployment of Azure Policy Definitions, Policy Sets (Initiatives), and Policy Assignments using CAF Enterprise Scale Rover, ensuring your Azure environment remains compliant, secure, and optimized.
Introduction to Azure Policies and CAF Rover
Azure Policies play a pivotal role in the governance framework of Azure environments. They enable organizations to define, assign, and manage policies that enforce rules over their resources, ensuring compliance with company standards and regulatory requirements. While Azure Policies are powerful, managing them across a large-scale environment can be daunting.
Enter CAF Enterprise Scale Rover, an innovative solution that streamlines the deployment and management of Azure Policies. It is designed to automate the process, making it easier, faster, and more efficient. By leveraging the CAF Rover, IT professionals can focus on strategic tasks, leaving the heavy lifting to the automation processes.
Setting Up Your Environment for CAF Rover
Before diving into the automation process, it’s essential to set up your environment to run the CAF Rover. This setup involves ensuring your development environment is ready, installing necessary tools like Docker, Terraform, Git, and configuring VSCode with specific extensions for Azure Policy and Docker support. Detailed guidance on setting up your environment can be found in the provided recommended reading, highlighting the importance of a properly configured dev environment for a seamless automation experience.
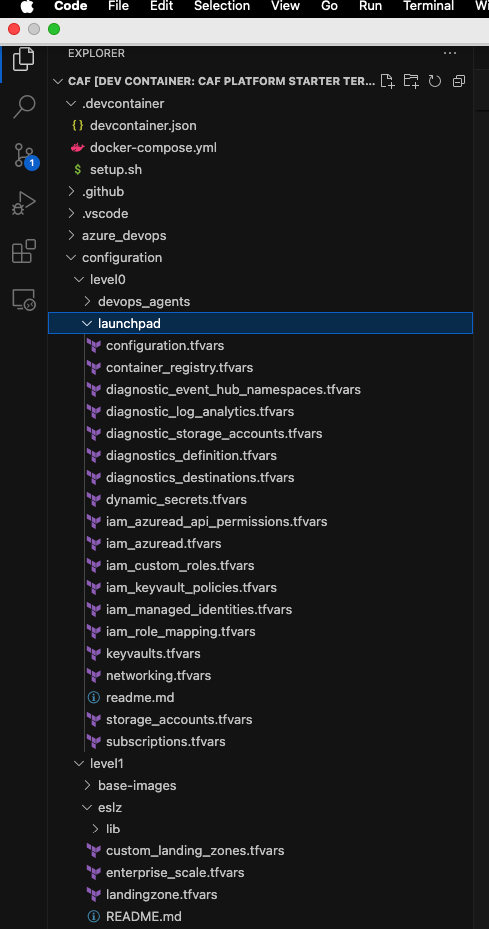
CAF Level Structure and eslz module for PoliciesPolicy Structure
You must plan out your Policy Definitions, then group them into Initiatives, and then assign initiatives to scopes (Management Groups or Subscriptions).
Automating Policy Definitions Deployment
The journey begins with automating Policy Definitions, the cornerstone of Azure Policy management. CAF Rover simplifies this process by leveraging a structured JSON format for defining policies, focusing on key areas such as allowed regions, naming conventions, and resource compliance checks. The process entails writing your Policy Definition in JSON, committing it to your Git repository, and deploying it to your Azure environment via CAF Rover commands. This approach ensures that all your cloud resources adhere to defined governance standards from the get-go.
Sample Policy Definition
{
  "name": "Append-AppService-httpsonly",
  "type": "Microsoft.Authorization/policyDefinitions",
  "apiVersion": "2021-06-01",
  "scope": null,
  "properties": {
    "policyType": "Custom",
    "mode": "All",
    "displayName": "AppService append enable https only setting to enforce https setting.",
    "description": "Appends the AppService sites object to ensure that  HTTPS only is enabled for  server/service authentication and protects data in transit from network layer eavesdropping attacks. Please note Append does not enforce compliance use then deny.",
    "metadata": {
      "version": "1.0.0",
      "category": "App Service",
      "source": "https://github.com/Azure/Enterprise-Scale/",
      "alzCloudEnvironments": [
        "AzureCloud",
        "AzureChinaCloud",
        "AzureUSGovernment"
      ]
    },
    "parameters": {
      "effect": {
        "type": "String",
        "defaultValue": "Append",
        "allowedValues": [
          "Audit",
          "Append",
          "Disabled"
        ],
        "metadata": {
          "displayName": "Effect",
          "description": "Enable or disable the execution of the policy"
        }
      }
    },
    "policyRule": {
      "if": {
        "allOf": [
          {
            "field": "type",
            "equals": "Microsoft.Web/sites"
          },
          {
            "field": "Microsoft.Web/sites/httpsOnly",
            "notequals": true
          }
        ]
      },
      "then": {
        "effect": "[parameters('effect')]",
        "details": [
          {
            "field": "Microsoft.Web/sites/httpsOnly",
            "value": true
          }
        ]
      }
    }
  }
}
Streamlining Policy Sets (Initiatives) Deployment
Next, we focus on Policy Sets, also known as Initiatives, which group multiple Policy Definitions for cohesive management. The CAF Rover enhances the deployment of Policy Sets by automating their creation and assignment. By grouping related policies, you can ensure comprehensive coverage of governance requirements, such as naming conventions and compliance checks, across your Azure resources. The automation process involves defining your Policy Sets in JSON format, committing them to your repository, and deploying them through CAF Rover, streamlining the governance of your cloud environment.
Sample Policy Set (Initiative)
{
  "name": "Audit-UnusedResourcesCostOptimization",
  "type": "Microsoft.Authorization/policySetDefinitions",
  "apiVersion": "2021-06-01",
  "scope": null,
  "properties": {
    "policyType": "Custom",
    "displayName": "Unused resources driving cost should be avoided",
    "description": "Optimize cost by detecting unused but chargeable resources. Leverage this Azure Policy Initiative as a cost control tool to reveal orphaned resources that are contributing cost.",
    "metadata": {
      "version": "2.0.0",
      "category": "Cost Optimization",
      "source": "https://github.com/Azure/Enterprise-Scale/",
      "alzCloudEnvironments": [
        "AzureCloud",
        "AzureChinaCloud",
        "AzureUSGovernment"
      ]
    },
    "parameters": {
      "effectDisks": {
        "type": "String",
        "metadata": {
          "displayName": "Disks Effect",
          "description": "Enable or disable the execution of the policy for Microsoft.Compute/disks"
        },
        "allowedValues": [
          "Audit",
          "Disabled"
        ],
        "defaultValue": "Audit"
      },
      "effectPublicIpAddresses": {
        "type": "String",
        "metadata": {
          "displayName": "PublicIpAddresses Effect",
          "description": "Enable or disable the execution of the policy for Microsoft.Network/publicIpAddresses"
        },
        "allowedValues": [
          "Audit",
          "Disabled"
        ],
        "defaultValue": "Audit"
      },
      "effectServerFarms": {
        "type": "String",
        "metadata": {
          "displayName": "ServerFarms Effect",
          "description": "Enable or disable the execution of the policy for Microsoft.Web/serverfarms"
        },
        "allowedValues": [
          "Audit",
          "Disabled"
        ],
        "defaultValue": "Audit"
      }
    },
    "policyDefinitions": [
      {
        "policyDefinitionReferenceId": "AuditDisksUnusedResourcesCostOptimization",
        "policyDefinitionId": "${current_scope_resource_id}/providers/Microsoft.Authorization/policyDefinitions/Audit-Disks-UnusedResourcesCostOptimization",
        "parameters": {
          "effect": {
            "value": "[parameters('effectDisks')]"
          }
        },
        "groupNames": []
      },
      {
        "policyDefinitionReferenceId": "AuditPublicIpAddressesUnusedResourcesCostOptimization",
        "policyDefinitionId": "${current_scope_resource_id}/providers/Microsoft.Authorization/policyDefinitions/Audit-PublicIpAddresses-UnusedResourcesCostOptimization",
        "parameters": {
          "effect": {
            "value": "[parameters('effectPublicIpAddresses')]"
          }
        },
        "groupNames": []
      },
      {
        "policyDefinitionReferenceId": "AuditServerFarmsUnusedResourcesCostOptimization",
        "policyDefinitionId": "${current_scope_resource_id}/providers/Microsoft.Authorization/policyDefinitions/Audit-ServerFarms-UnusedResourcesCostOptimization",
        "parameters": {
          "effect": {
            "value": "[parameters('effectServerFarms')]"
          }
        },
        "groupNames": []
      },
      {
        "policyDefinitionReferenceId": "AuditAzureHybridBenefitUnusedResourcesCostOptimization",
        "policyDefinitionId": "${current_scope_resource_id}/providers/Microsoft.Authorization/policyDefinitions/Audit-AzureHybridBenefit",
        "parameters": {
          "effect": {
            "value": "Audit"
          }
        },
        "groupNames": []
      }
    ],
    "policyDefinitionGroups": null
  }
}
Automating Policy Assignments
The final piece of the automation puzzle is Policy Assignments. This step activates the policies, applying them to your Azure resources. CAF Rover facilitates the automation of both custom and built-in Policy Assignments, ensuring your resources are governed according to the defined policies. Whether you are assigning custom initiatives or leveraging Azure’s built-in policies for zone resilience, the process is simplified through automation, allowing for efficient and effective governance at scale.
Sample Policy Assignment
{
  "type": "Microsoft.Authorization/policyAssignments",
  "apiVersion": "2022-06-01",
  "name": "as_baseline_security",
  "dependsOn": [],
  "properties": {
    "description": "This assignment includes EDG baseline security policies.",
    "displayName": "Custom baseline security",
    "policyDefinitionId": "${current_scope_resource_id}/providers/Microsoft.Authorization/policySetDefinitions/custom_baseline_security",
    "enforcementMode": null,
    "metadata": {
    },
    "nonComplianceMessages": [
      {
        "policyDefinitionReferenceId": "custom_audit_function_app_require_msi_tf_1",
        "message": "FUNC-001 - Use Azure-managed identity to securely authenticate to other cloud services/resources"
      },
      {
        "policyDefinitionReferenceId": "custom_deny_function_app_remotedebugging_tf_1",
        "message": "FUNC-014 - Turn off Remote debugging on your Function apps"
      },
      {
        "policyDefinitionReferenceId": "custom_deny_mismatched_res_resgroup_locations_tf_1",
        "message": "AZ-001 - Resource has been deployed in a different location from the resource group containing it"
      },
      {
        "policyDefinitionReferenceId": "custom_deny_non_allowed_resource_locations_tf_1",
        "message": "AZ-002 - Resource has been deployed in an unauthorised location"
      },
      {
        "policyDefinitionReferenceId": "custom_deny_storage_acc_accessible_over_http_tf_1",
        "message": "ST-013 - Enforce data encryption in transit by enabling HTTPS only"
      },
      {
        "policyDefinitionReferenceId": "custom_deny_storage_acc_disable_public_network_tf_1",
        "message": "ST-001 - Disable public network access"
      },
      {
        "policyDefinitionReferenceId": "custom_deploy_function_app_accessible_over_http_tf_1",
        "message": "FUNC-003 - Enforce data encryption in transit by enabling HTTPS only"
      },
      {
        "policyDefinitionReferenceId": "custom_deploy_function_app_require_ftps_only_tf_1",
        "message": "FUNC-009 - Disable FTP based deployment or configure to accept FTPS only"
      },
      {
        "policyDefinitionReferenceId": "custom_deploy_function_app_require_tls12_tf_1",
        "message": "FUNC-004 - Enforce minimum TLS version to 1.2"
      }
    ],
    "parameters": {
    },
    "scope": "${current_scope_resource_id}",
    "notScopes": []
  },
  "location": "${default_location}",
  "identity": {
    "type": "SystemAssigned"
  }
}
Archetypes
Archetypes are used in the Azure landing zone conceptual architecture to describe the Landing Zone configuration using a template-driven approach. The archetype is what fundamentally transforms Management Groups and Subscriptions into Landing Zones.
An archetype defines which Azure Policy and Access control (IAM) settings are needed to secure and configure the Landing Zones with everything needed for safe handover to the Landing Zone owner. This covers critical platform controls and configuration items, such as:
Consistent role-based access control (RBAC) settings
Guardrails for security settings
Guardrails for common workload configurations (e.g. SAP, AKS, WVD, etc.)
Automate provisioning of critical platform resources such as monitoring and networking solutions in each Landing Zone
This approach provides improved autonomy for application teams, whilst ensuring security policies and standards are enforced.
This tool greatly simplifies secure state management on Azure storage accounts. Additionally, it helps with testing different versions of binaries such as new versions of Terraform, Azure CLI, jq, tflint, etc. This tool also provides a ubiquitous development environment, which means everyone works with the same versions of the DevOps toolchain, always up-to-date, and runs on laptops, pipelines, GitHub Codespaces, and other platforms. It also facilitates the identity transition to any CI/CD, as all CI/CD have container capabilities. This tool allows for easy transition from one DevOps environment to another, including GitHub Actions, Azure DevOps, Jenkins, CircleCI, etc. Lastly, it’s an open-source tool and leverages open-source projects that are often needed with Terraform.
Helps testing different versions of binaries (new version of Terraform, Azure CLI, jq, tflint etc.)
Ubiquitous development environment: everyone works with the same versions of the DevOps toolchain, always up-to-date, running on laptop, pipelines, GitHub Codespaces, etc.
Facilitates the identity transition to any CI/CD: namely all CI/CD have container capabilities.
Allows easy transition from one DevOps environment to another (GitHub Actions, Azure DevOps, Jenkins, CircleCI etc.)
It’s open-source and leveraging open-source projects that you often need with Terraform.
Rover Completion – Return 0
Integrating with Azure DevOps Pipelines
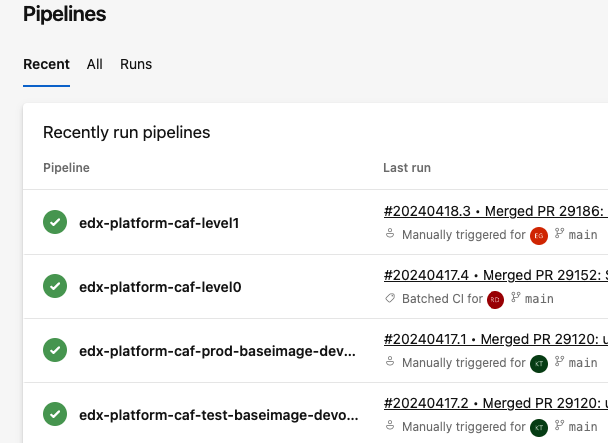
A critical aspect of automating Azure Policy deployment using CAF Enterprise Scale Rover is its seamless integration with Azure DevOps pipelines. This integration enables organizations to adopt a DevOps approach to cloud governance, where policy changes are version-controlled, reviewed, and deployed through automated CI/CD pipelines. By incorporating CAF Rover into Azure DevOps pipelines, you can ensure that policy deployments are consistent, repeatable, and auditable across different environments. This process not only enhances governance and compliance but also aligns with best practices for Infrastructure as Code (IaC), facilitating a collaborative and efficient workflow among development, operations, and security teams. Leveraging Azure DevOps pipelines with CAF Rover automation empowers organizations to maintain a high governance standard while embracing the agility and speed that cloud environments offer.
Azure DevOps Pipeline – CICD
Conclusion
Automating the deployment of Azure Policy Definitions, Policy Sets (Initiatives), and Policy Assignments using CAF Enterprise Scale Rover represents a significant leap forward in cloud governance. This approach not only saves time and reduces the potential for human error but also ensures a consistent and compliant Azure environment. By embracing automation with CAF Rover, organizations can achieve a robust governance framework that scales with their Azure deployments, securing their cloud journey’s success.
For those keen to automate their Azure Policies, diving into the CAF Rover’s capabilities is a must. The combination of detailed documentation, structured JSON for policy definitions, and automated deployment processes provides a clear path to efficient and effective Azure governance. Embrace the power of automation with CAF Enterprise Scale Rover and take your Azure governance to the next level.
It has been a while since I wrote about memory dump analysis; the last post on the subject was back in 2011. Lets get stuck into the dark arts.
First and foremost, .NET is very different to .NET Core, down to App Domains and how the MSIL is executed. Understanding this is crucial before you kick off a clrstack! or dumpdomain! Make sure you understand the architecture of what you debugging from ASP to console apps. Dumpdomain caught me off guard, as you would use dumpdomain to get the sourcecode and decompile via the PDB files in the past.
Feature
ASP.NET Core
ASP.NET Framework
Cross-Platform Support
Runs on Windows, Linux, and macOS.
Primarily runs on Windows.
Hosting
Can be hosted on Kestrel, IIS, HTTP.sys, Nginx, Apache, and Docker.
Typically hosted on IIS.
Performance
Optimized for high performance and scalability.
Good performance, but generally not as optimized as ASP.NET Core.
Application Model
Unified model for MVC and Web API.
Separate models for MVC and Web API.
Configuration
Uses a lightweight, file-based configuration system (appsettings.json).
Uses web.config for configuration.
Dependency Injection
Built-in support for dependency injection.
Requires third-party libraries for dependency injection.
App Domains
Uses a single app model and does not support app domains.
Supports app domains for isolation between applications.
Runtime Compilation
Supports runtime compilation of Razor views (optional).
Supports runtime compilation of ASPX pages.
Modular HTTP Pipeline
Highly modular and configurable HTTP request pipeline.
Fixed HTTP request pipeline defined by the Global.asax and web.config.
Package Management
Uses NuGet for package management, with an emphasis on minimal dependencies.
Also uses NuGet but tends to have more complex dependency trees.
Framework Versions
Applications target a specific version of .NET Core, which is bundled with the app.
Applications target a version of the .NET Framework installed on the server.
Update Frequency
Rapid release cycle with frequent updates and new features.
Slower release cycle, tied to Windows updates.
Side-by-Side Deployment
Supports running multiple versions of the app or .NET Core side-by-side.
Does not support running multiple versions of the framework side-by-side for the same application.
Open Source
Entire platform is open-source.
Only a portion of the platform is open-source.
So we embark on a quest to uncover hidden memory leaks that lurk within the depths of .NET Core apps, armed with the mighty dotnet-dump utility. This tale of debugging prowess will guide you through collecting and analyzing dump files, uncovering the secrets of memory leaks, and ultimately conquering these elusive beasts.
Preparing for the Hunt: Installing dotnet-dump
Our journey begins with the acquisition of the dotnet-dump tool, a valiant ally in our quest. This tool is a part of the .NET diagnostics toolkit, designed to collect and analyze dumps without requiring native debuggers. It’s a lifesaver on platforms like Alpine Linux, where traditional tools shy away.
To invite dotnet-dump into your arsenal, you have two paths:
The Global Tool Approach: Unleash the command dotnet tool install --global dotnet-dump into your terminal and watch as the latest version of the dotnet-dump NuGet package is summoned.
The Direct Download: Navigate to the mystical lands of the .NET website and download the tool executable that matches your platform’s essence.
The First Step: Collecting the Memory Dump
With dotnet-dump by your side, it’s time to collect a memory dump from the process that has been bewitched by the memory leak. Invoke dotnet-dump collect --process-id <PID>, where <PID> is the identifier of the cursed process. This incantation captures the essence of the process’s memory, storing it in a file for later analysis.
The Analytical Ritual: Unveiling the Mysteries of the Dump
Now, the real magic begins. Use dotnet-dump analyze <dump_path> to enter an interactive realm where the secrets of the dump file are yours to discover. This enchanted shell accepts various SOS commands, granting you the power to scrutinize the managed heap, reveal the relationships between objects, and formulate theories about the source of the memory leak.
Common Spells and Incantations:
clrstack: Summons a stack trace of managed code, revealing the paths through which the code ventured.
dumpheap -stat: Unveils the statistics of the objects residing in the managed heap, highlighting the most common culprits.
gcroot <address>: Traces the lineage of an object back to its roots, uncovering why it remains in memory.
The Final Confrontation: Identifying the Memory Leak
Armed with knowledge and insight from the dotnet-dump analysis, you’re now ready to face the memory leak head-on. By examining the relationships between objects and understanding their roots, you can pinpoint the source of the leak in your code.
Remember, the key to vanquishing memory leaks is patience and perseverance. With dotnet-dump as your guide, you’re well-equipped to navigate the complexities of .NET Core memory management and emerge victorious.
Examine managed memory usage
Before you start collecting diagnostic data to help root cause this scenario, make sure you’re actually seeing a memory leak (growth in memory usage). You can use the dotnet-counters tool to confirm that.
Open a console window and navigate to the directory where you downloaded and unzipped the sample debug target. Run the target:
Press p to pause, r to resume, q to quit.
    Status: Running

[System.Runtime]
    # of Assemblies Loaded                           118
    % Time in GC (since last GC)                       0
    Allocation Rate (Bytes / sec)                 37,896
    CPU Usage (%)                                      0
    Exceptions / sec                                   0
    GC Heap Size (MB)                                  4
    Gen 0 GC / sec                                     0
    Gen 0 Size (B)                                     0
    Gen 1 GC / sec                                     0
    Gen 1 Size (B)                                     0
    Gen 2 GC / sec                                     0
    Gen 2 Size (B)                                     0
    LOH Size (B)                                       0
    Monitor Lock Contention Count / sec                0
    Number of Active Timers                            1
    ThreadPool Completed Work Items / sec             10
    ThreadPool Queue Length                            0
    ThreadPool Threads Count                           1
    Working Set (MB)                                  83
Focusing on this line:
GC Heap Size (MB) 4
You can see that the managed heap memory is 4 MB right after startup.
Now, go to the URL https://localhost:5001/api/diagscenario/memleak/20000.
Observe that the memory usage has grown to 30 MB.
GC Heap Size (MB)                                 30


By watching the memory usage, you can safely say that memory is growing or leaking. The next step is to collect the right data for memory analysis.
Generate memory dump
When analyzing possible memory leaks, you need access to the app’s memory heap to analyze the memory contents. Looking at relationships between objects, you create theories as to why memory isn’t being freed. A common diagnostic data source is a memory dump on Windows or the equivalent core dump on Linux. To generate a dump of a .NET application, you can use the dotnet-dump tool.
Using the sample debug target previously started, run the following command to generate a Linux core dump:
dotnet-dump collect -p 4807
The result is a core dump located in the same folder.
Writing minidump with heap to ./core_20190430_185145
Complete
For a comparison over time, let the original process continue running after collecting the first dump and collect a second dump the same way. You would then have two dumps over a period of time that you can compare to see where the memory usage is growing.
Restart the failed process
Once the dump is collected, you should have sufficient information to diagnose the failed process. If the failed process is running on a production server, now it’s the ideal time for short-term remediation by restarting the process.
In this tutorial, you’re now done with the Sample debug target and you can close it. Navigate to the terminal that started the server, and press Ctrl+C.
Analyze the core dump
Now that you have a core dump generated, use the dotnet-dump tool to analyze the dump:
dotnet-dump analyze core_20190430_185145
Where core_20190430_185145 is the name of the core dump you want to analyze.
If you see an error complaining that libdl.so cannot be found, you may have to install the libc6-dev package. For more information, see Prerequisites for .NET on Linux.
You’ll be presented with a prompt where you can enter SOS commands. Commonly, the first thing you want to look at is the overall state of the managed heap:
You can see that the String is directly held by the Customer object and indirectly held by a CustomerCache object.
You can continue dumping out objects to see that most String objects follow a similar pattern. At this point, the investigation provided sufficient information to identify the root cause in your code.
This general procedure allows you to identify the source of major memory leaks.
Epilogue: Cleaning Up After the Battle
With the memory leak defeated and peace restored to your application, take a moment to clean up the battlefield. Dispose of the dump files that served you well, and consider restarting your application to ensure it runs free of the burdens of the past.
Embark on this journey with confidence, for with dotnet-dump and the wisdom contained within this guide, you are more than capable of uncovering and addressing the memory leaks that challenge the stability and performance of your .NET Core applications. Happy debugging!


You must be logged in to post a comment.