For leaders and executives, the promise of Generative AI is immense, but the risk of unreliable output is often what stalls adoption. When deploying AI into production, a prompt that works in a chat window is not the same as a prompt that works at scale.
I’ve spent the last couple of weeks applying these concepts to build birdcall.co.za and an advanced surf-forecasting widget for oceaneye.co.za – my pet projects. By leveraging Claude, “Agentic” workflows, and strict evaluation pipelines, I’ve moved from “guessing” if a prompt works to having objective, measurable data that it actually performs.
Here is the S.D.O.L. breakdown of how to adopt AI in organizations while keeping risk front-of-center.
Situation
In serious applications—like managing a complex AWS infrastructure stack or generating precise wave decay algorithms for South African beaches—the “it works on my machine” approach is a liability. Users provide unexpected inputs that break standard prompts, leading to production incidents.
Decision
I decided to stop treating prompts as static text and started treating them as code. I moved from manual, subjective testing to a Prompt Evaluation Workflow. This shifts the development lifecycle from “write and pray” to “iterate based on metrics.”
Outcome
By implementing an automated evaluation pipeline, my first deployment of a complex AWS stack (CloudFront, S3, Lambda, DynamoDB, Cognito, Stripe) ran with zero issues on the first attempt. Similarly, at Oceaneye, we use a hybrid grading system—combining code-based validation for algorithms and human-feedback loops—to refine forecasts for specific GPS locations.
Lesson: The “Evaluation-First” Mindset
Most engineers fall into the trap of testing a prompt once and calling it “good.” In production, that prompt will break. To manage risk, you must adopt an evaluation-first approach.
The 5-Step Evaluation Pipeline
Draft a Prompt: Start with a baseline instruction.
Create an Eval Dataset: Use a diverse set of real-world inputs (or use Claude to generate them) to test your prompt’s boundaries.
Feed Through Claude: Run your inputs against the prompt.
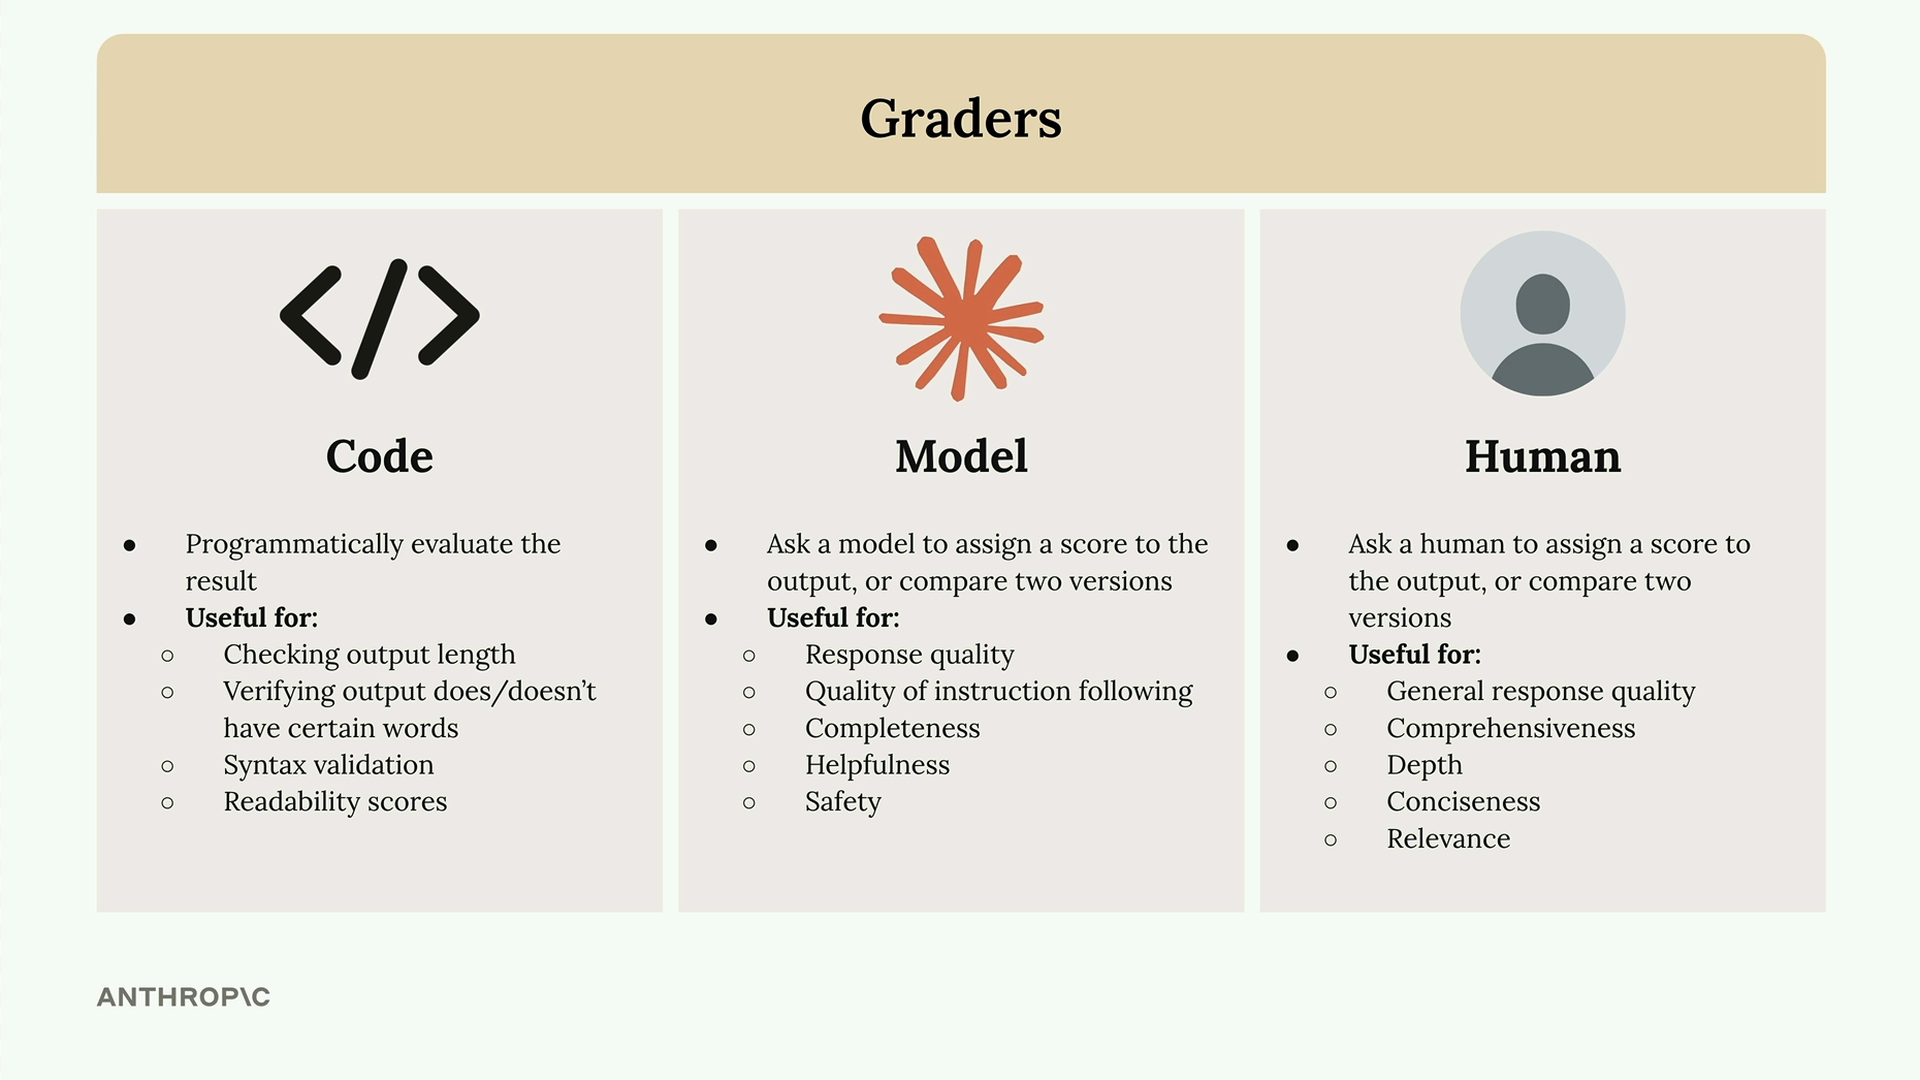
Feed Through a Grader: This is the most critical step. Use Code Graders (to check syntax), Model Graders (to score quality), or Human Graders (for nuanced relevance).
Change Prompt and Repeat: Iterate until your objective metrics reach your internal reliability threshold.
How to Start
Don’t wait for your team to build a massive infrastructure. Start by replacing the “I think this is good” mentality with a simple scoring system:
For Code Generation: Use a Code Grader that attempts to parse the output. If the code doesn’t parse, the score is 0. This is an objective, binary gate.
For Logic/Reasoning: Use a Model Grader. Ask a secondary instance of Claude to review the output against your requirements and assign a score (1-10) with reasoning.
For Real-World Feedback: Use a Human Grader. For Oceaneye, when our forecasts don’t match the actual surf conditions, that feedback is ingested, and Claude then generates new test simulations to “patch” the underlying algorithm.
The Bottom Line
Reliability isn’t a feature; it’s a process. By building evaluation into your workflow, you don’t just “prompt”—you engineer. You transform your AI applications from experimental toys into stable, enterprise-grade tools that can handle the unpredictability of the real world.
How is your organization measuring the success of your prompts? Are you still relying on manual spot checks, or have you started automating your evaluation?
As Peter L. Bernstein brilliantly points out in his book Against the Gods: The Remarkable Story of Risk, “The word ‘risk’ derives from the early Italian risicare, which means ‘to dare’. In this sense, risk is a choice rather than a fate.”
Right now, the corporate world is facing a massive choice with Artificial Intelligence. We can either dare to use it strategically to elevate our engineering teams, or we can take the lazy—and ultimately fatal—risk of using it just to cut corners.
Having spent over two and a half decades architecting multi-cloud strategies and wrangling massive platform engineering operations, I’ve seen every tech hype cycle roll in like a heavy winter swell. But AI is different. To truly ride this wave without wiping out, organizations need a solid foundation. We need AI Fluency, which means developing the practical skills, insights, and values to work with AI in ways that are safe, ethical, efficient, and effective.
The Trap of Cost-Cutting vs. The Power of Multiplication
Let’s get one thing straight: adopting AI primarily as an excuse to offshore your engineering team or slash headcount is a notoriously short-sighted trap. It actively destroys your company’s domain expertise. Imagine trying to maintain a critical backend integration layer that an AI generated, but you no longer have the engineers with the domain knowledge to actually read, understand, or fix it!
Instead of mass layoffs, smart leaders are turning their people into force multipliers. We should be retraining our senior software engineers into AI orchestrators and directors. Think about upskilling your team into AI Skills or MCP (Model Context Protocol) engineers who can build deep, secure integrations into your existing Kubernetes clusters and CI/CD pipelines. You don’t replace the pilot; you upgrade the cockpit so they can manage a whole squadron.
How We Actually Work with AI
Before we dig into the framework, it helps to understand the three distinct ways we engage with these systems.
Automation: This is the baseline level where the AI simply executes specific tasks based directly on your instructions.
Augmentation: In this mode, you and the AI team up as creative thinking and execution partners, bouncing ideas back and forth to refine a solution.
Agency: The ultimate goal for complex operations, where you configure the AI to act independently on your behalf by establishing its behavioral patterns rather than dictating exact steps.
The 4Ds: Your AI Flight Manual
To make human-AI collaboration actually work, we rely on the four core competencies of the AI Fluency framework: the 4Ds.
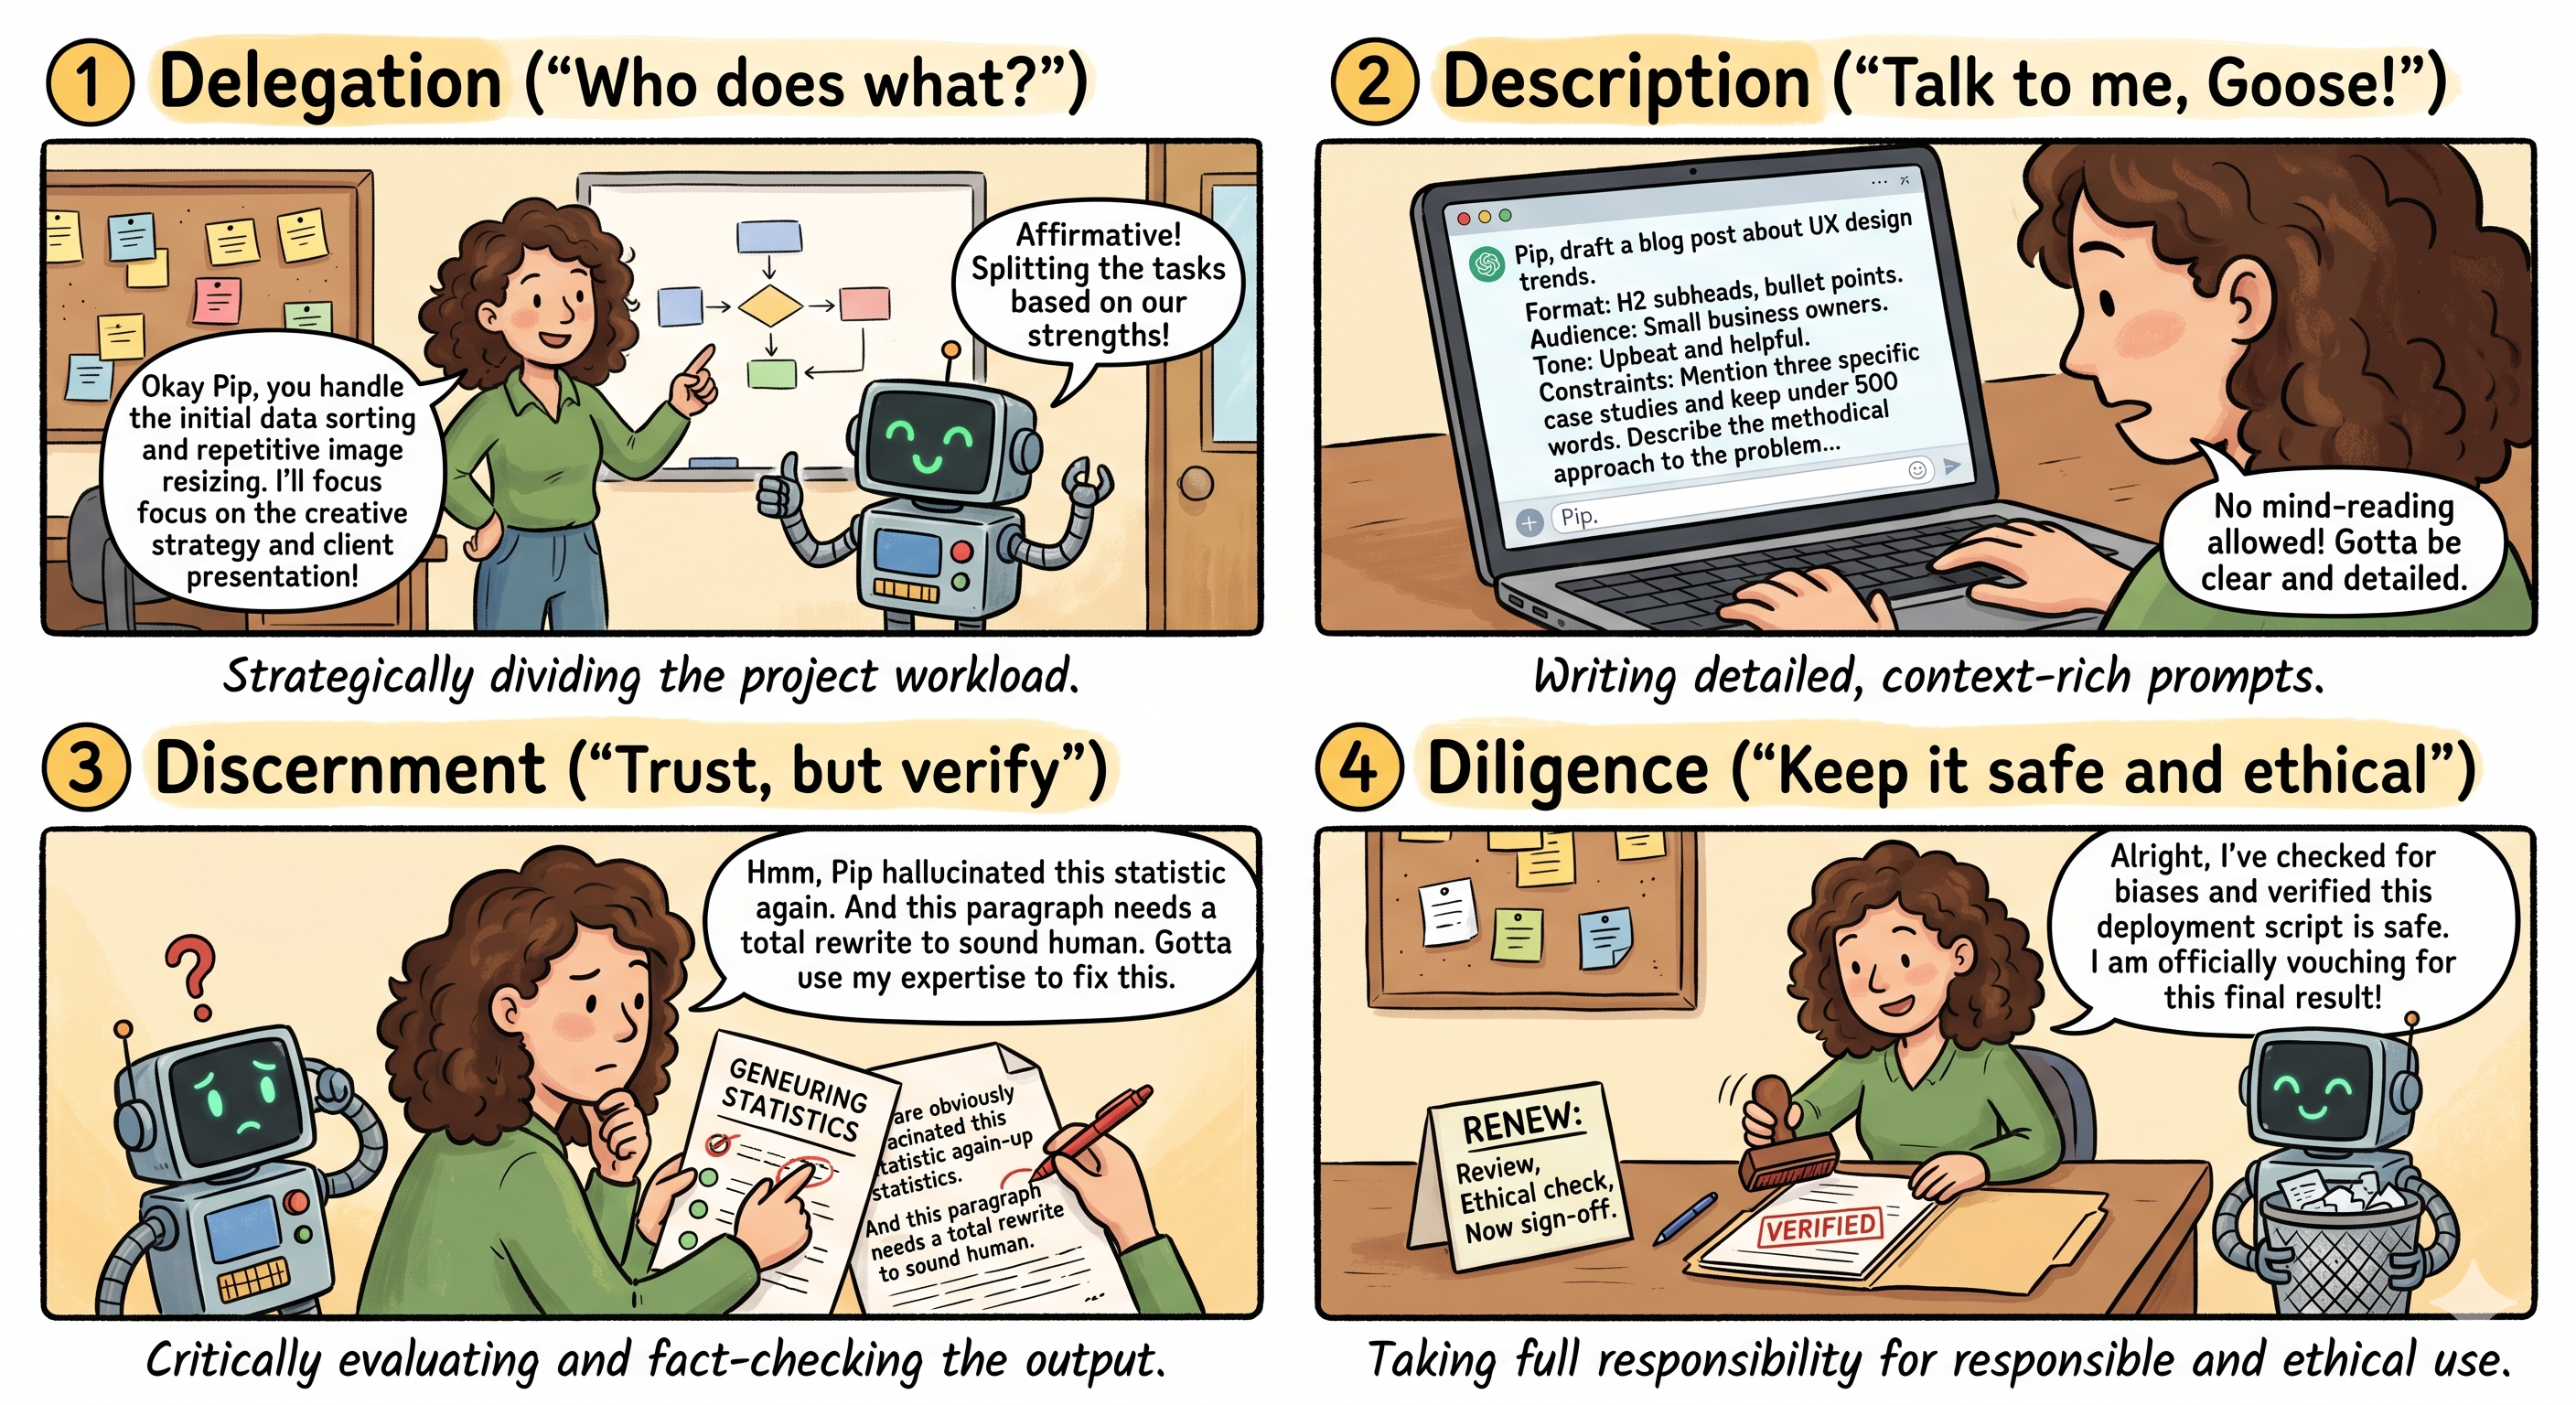
1. Delegation (Who does what?)
Delegation is about strategically deciding what work you should tackle, what the AI should handle, and how to distribute the load between you. It requires you to clearly understand your own project goals and the nature of the problem before you even open a chat window. Remember, the goal isn’t to automate everything in sight; it’s to leverage the unique strengths of both the human and the machine.
2. Description (Talk to me, Goose!)
This is the heart of prompt engineering. Description means clearly defining your desired outputs, the format, and how exactly the AI should approach the problem. AI models are interactive systems, not static databases or mind-readers. They need context, constraints, and clear roles to function properly. Breaking complex tasks into smaller, logical steps guides the AI’s reasoning process and ensures a much more methodical response. (Pro tip: If you are ever stuck, just describe your goal to the AI and ask it to help you write the prompt—it’s a secret weapon!)
3. Discernment (Trust, but verify)
This is where your hard-earned domain expertise shines. Discernment is the ability to critically evaluate what the AI produces, how it arrived at that answer, and how it behaves. Is it hallucinating a non-existent API endpoint? Did its logic get stuck in a loop? You must evaluate the product, the process, and the performance of the AI.
To borrow another thought from Bernstein: “The essence of risk management lies in maximizing the areas where we have some control over the outcome while minimizing the areas where we have absolutely no control…” Discernment is exactly how we maintain that control.
4. Diligence (Keep it safe and ethical)
Finally, Diligence is about using AI responsibly. This means being deeply thoughtful about which systems you use and remaining transparent about the AI’s role in your work. Most importantly, it means taking full accountability for verifying and vouching for the outputs you deploy. If an AI writes a faulty deployment script and it takes down production, that’s on you, not the bot.
Wrapping Up
AI isn’t here to do our jobs for us; it’s a technology that helps us do our jobs better. By adopting the 4Ds and treating AI as an interactive partner rather than a cheap replacement for top-tier talent, we can build more resilient, scalable, and innovative platforms.
Let’s dare to lead with strategy, manage the risks, and empower our engineers and domain experts to orchestrate the future.
Most people think they’re absolutely crushing the AI game because they managed to coax a decent, semi-coherent response out of ChatGPT.
I hate to break it to you, but that was a flex six months ago. Today? It’s the bare minimum.
We are currently sitting on the edge of the next massive technological shift: AI Agents. And let me tell you from years of sitting in the boardrooms of billion-dollar companies, the gap between the leaders who understand this shift and the ones who don’t is about to get incredibly expensive.
The good news? Agents are actually much simpler than the tech world wants you to think. You don’t need a PhD in computer science to lead this transition—you just need a shift in perspective.
Let’s break down how agents actually work, how to spot the best opportunities to use them, and why this is a leadership game, not a tech geek game.
The Mental Shift: From Student Driver to Chauffeur
Most professionals are still treating AI like a glorified Google search. We type in a prompt, get an answer, and think we’re high-tech.
But there is a massive difference between a Prompt and an Agent.
Prompting is like sitting next to a student driver: You have to constantly watch them, correct their steering, tell them when to brake, and stay on high alert. It’s exhausting.
An Agent is a hired chauffeur: You hop in the back seat, hand over the keys, and state the destination. The agent figures out the route, handles the traffic, and makes the step-by-step decisions to get you there.
[Agents] -> Requires a clear destination, then executes autonomously.
To make this practical, look at how the workload changes:
The Old Way (Prompt)
The New Way (Agent)
“Write me a LinkedIn post about AI trends.”
“Every Monday, scan my industry for the top 3 stories. Study my past content voice. Draft a new post based on those stories, revise it against my style guide, and schedule it for Tuesday morning.”
See the difference? A chatbot waits for your next command. An agent figures out its next move.
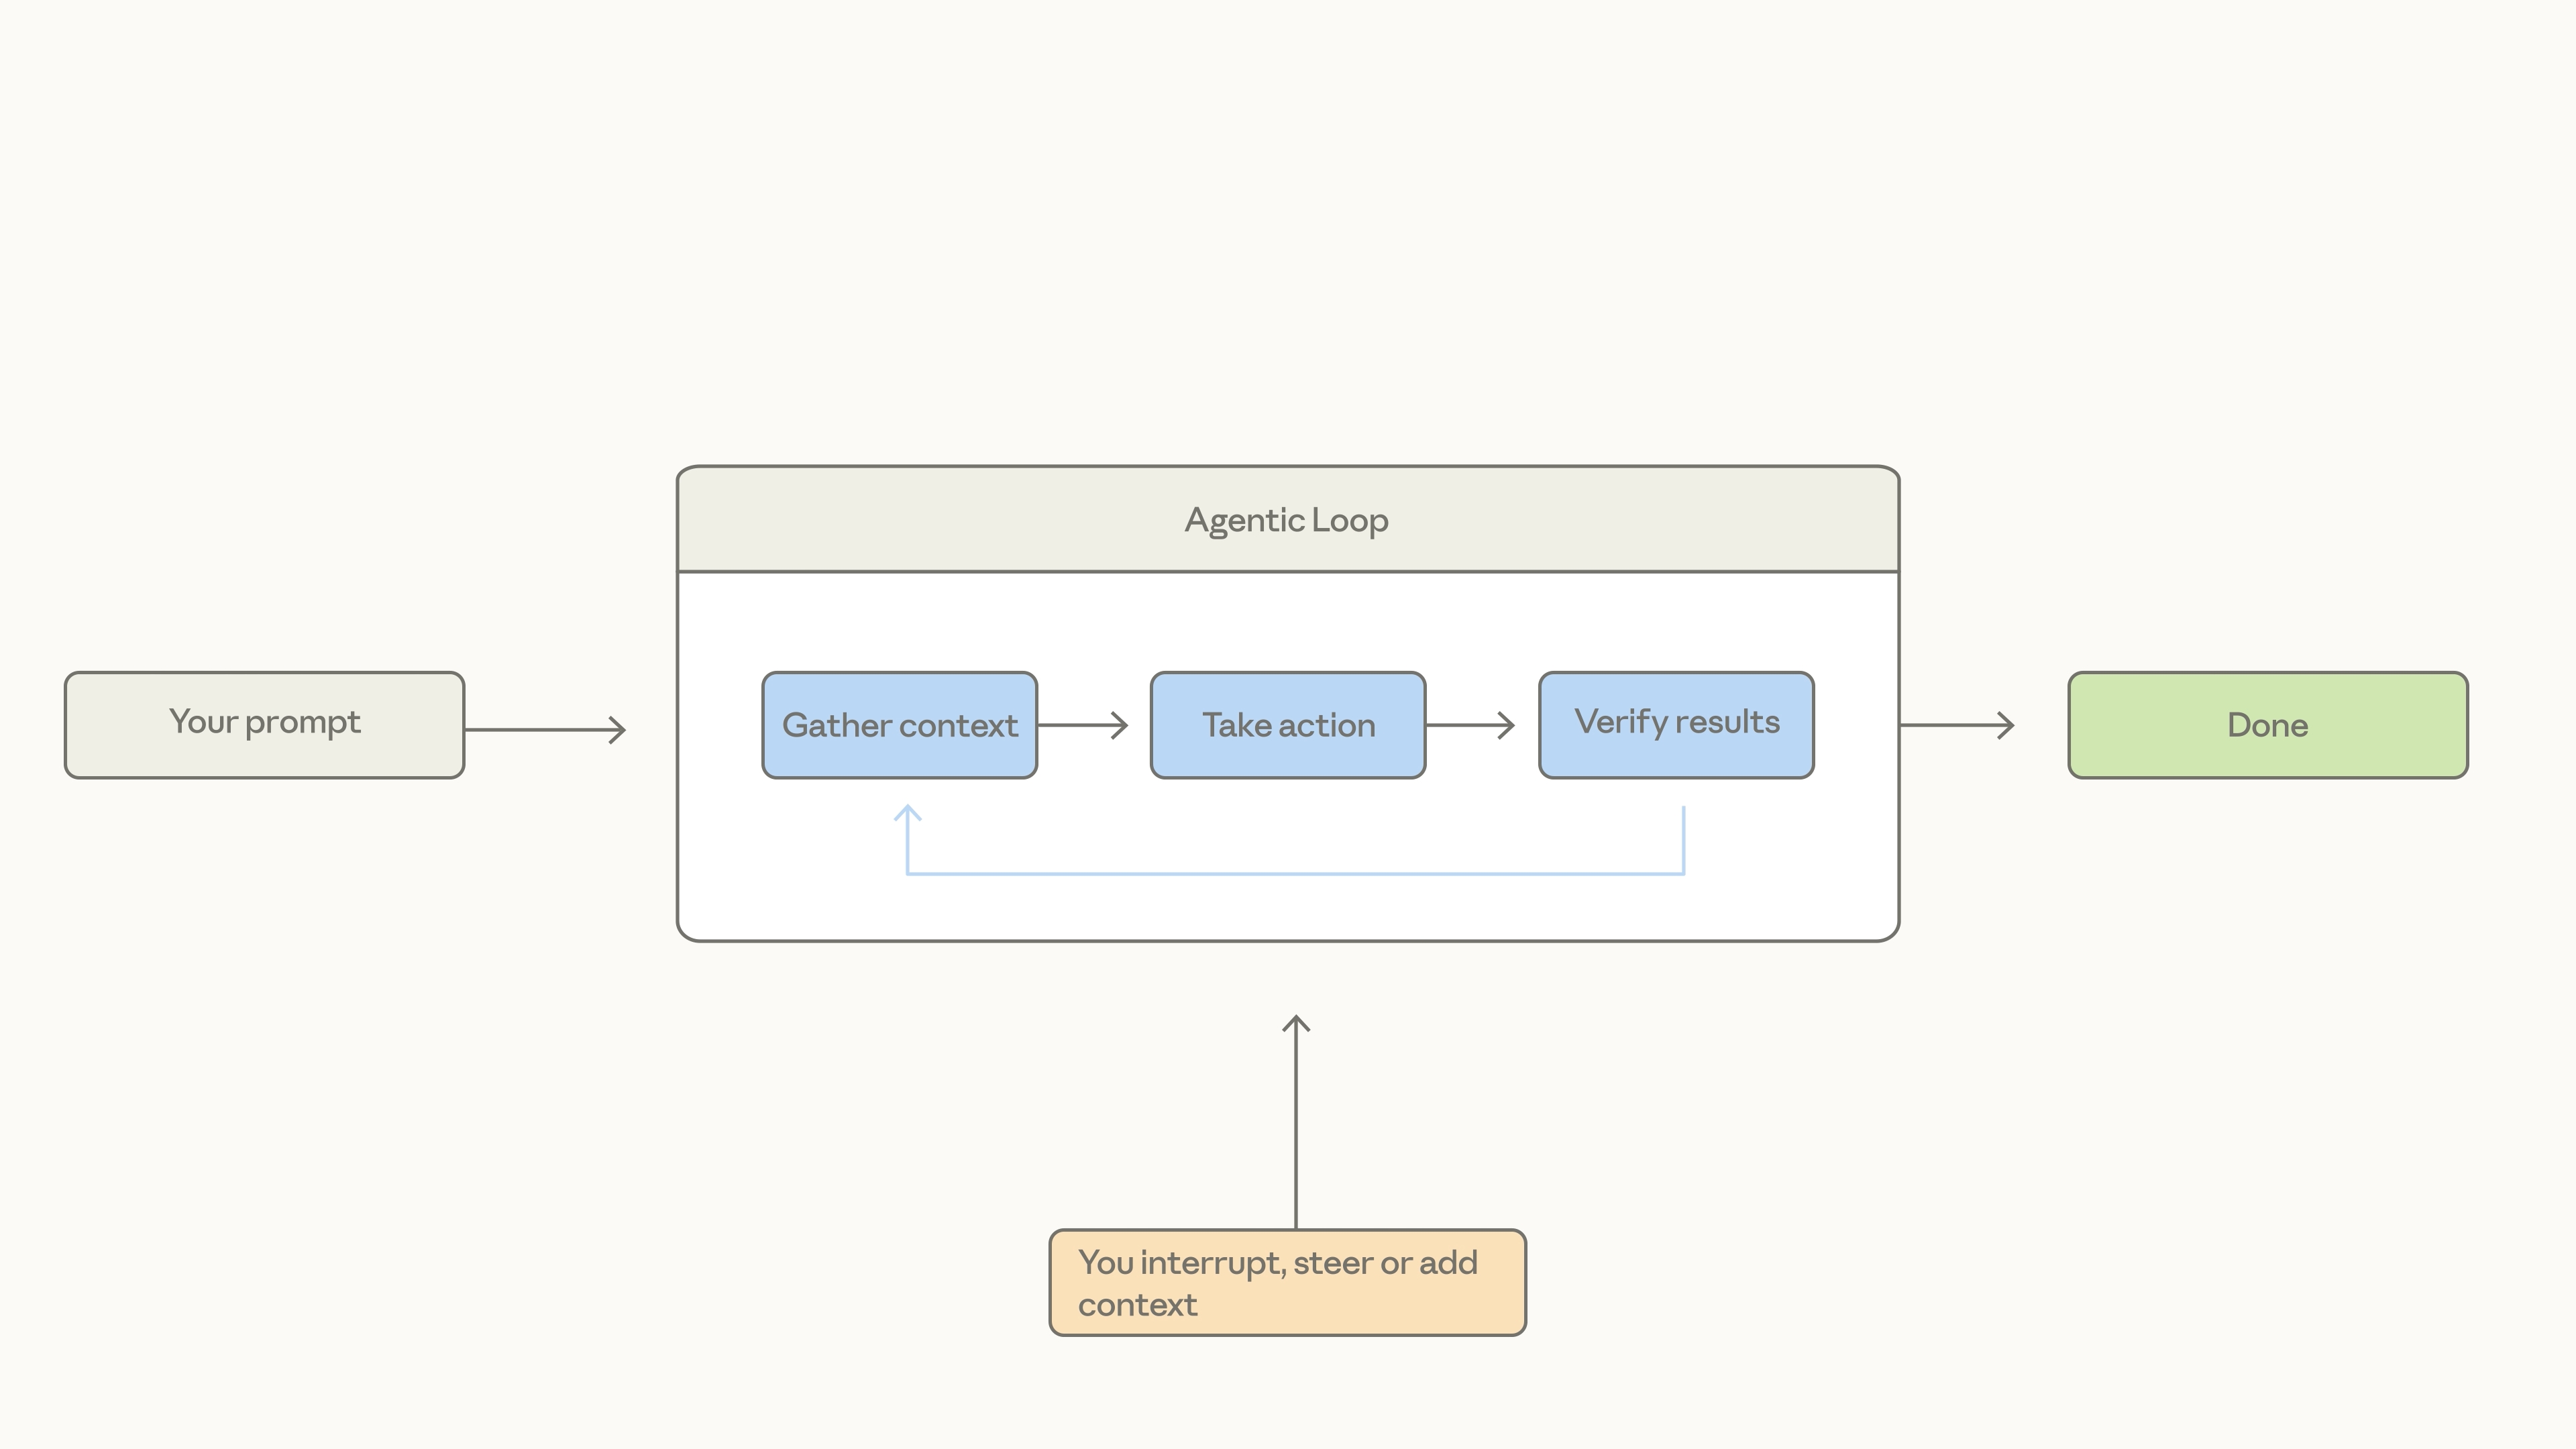
Under the Hood: The Four Hidden Workers
Everyone is talking about agents, but almost nobody can tell you what they actually do.
A standard LLM (Large Language Model) is just a math engine predicting the next most likely word based on probabilities. If you say, “Jack fell down and broke his…” it doesn’t “know” the nursery rhyme; its training just tells it there is a 99% probability the next token should be “crown.”
An agent uses that exact same language model, but surrounds it with four distinct operational roles:
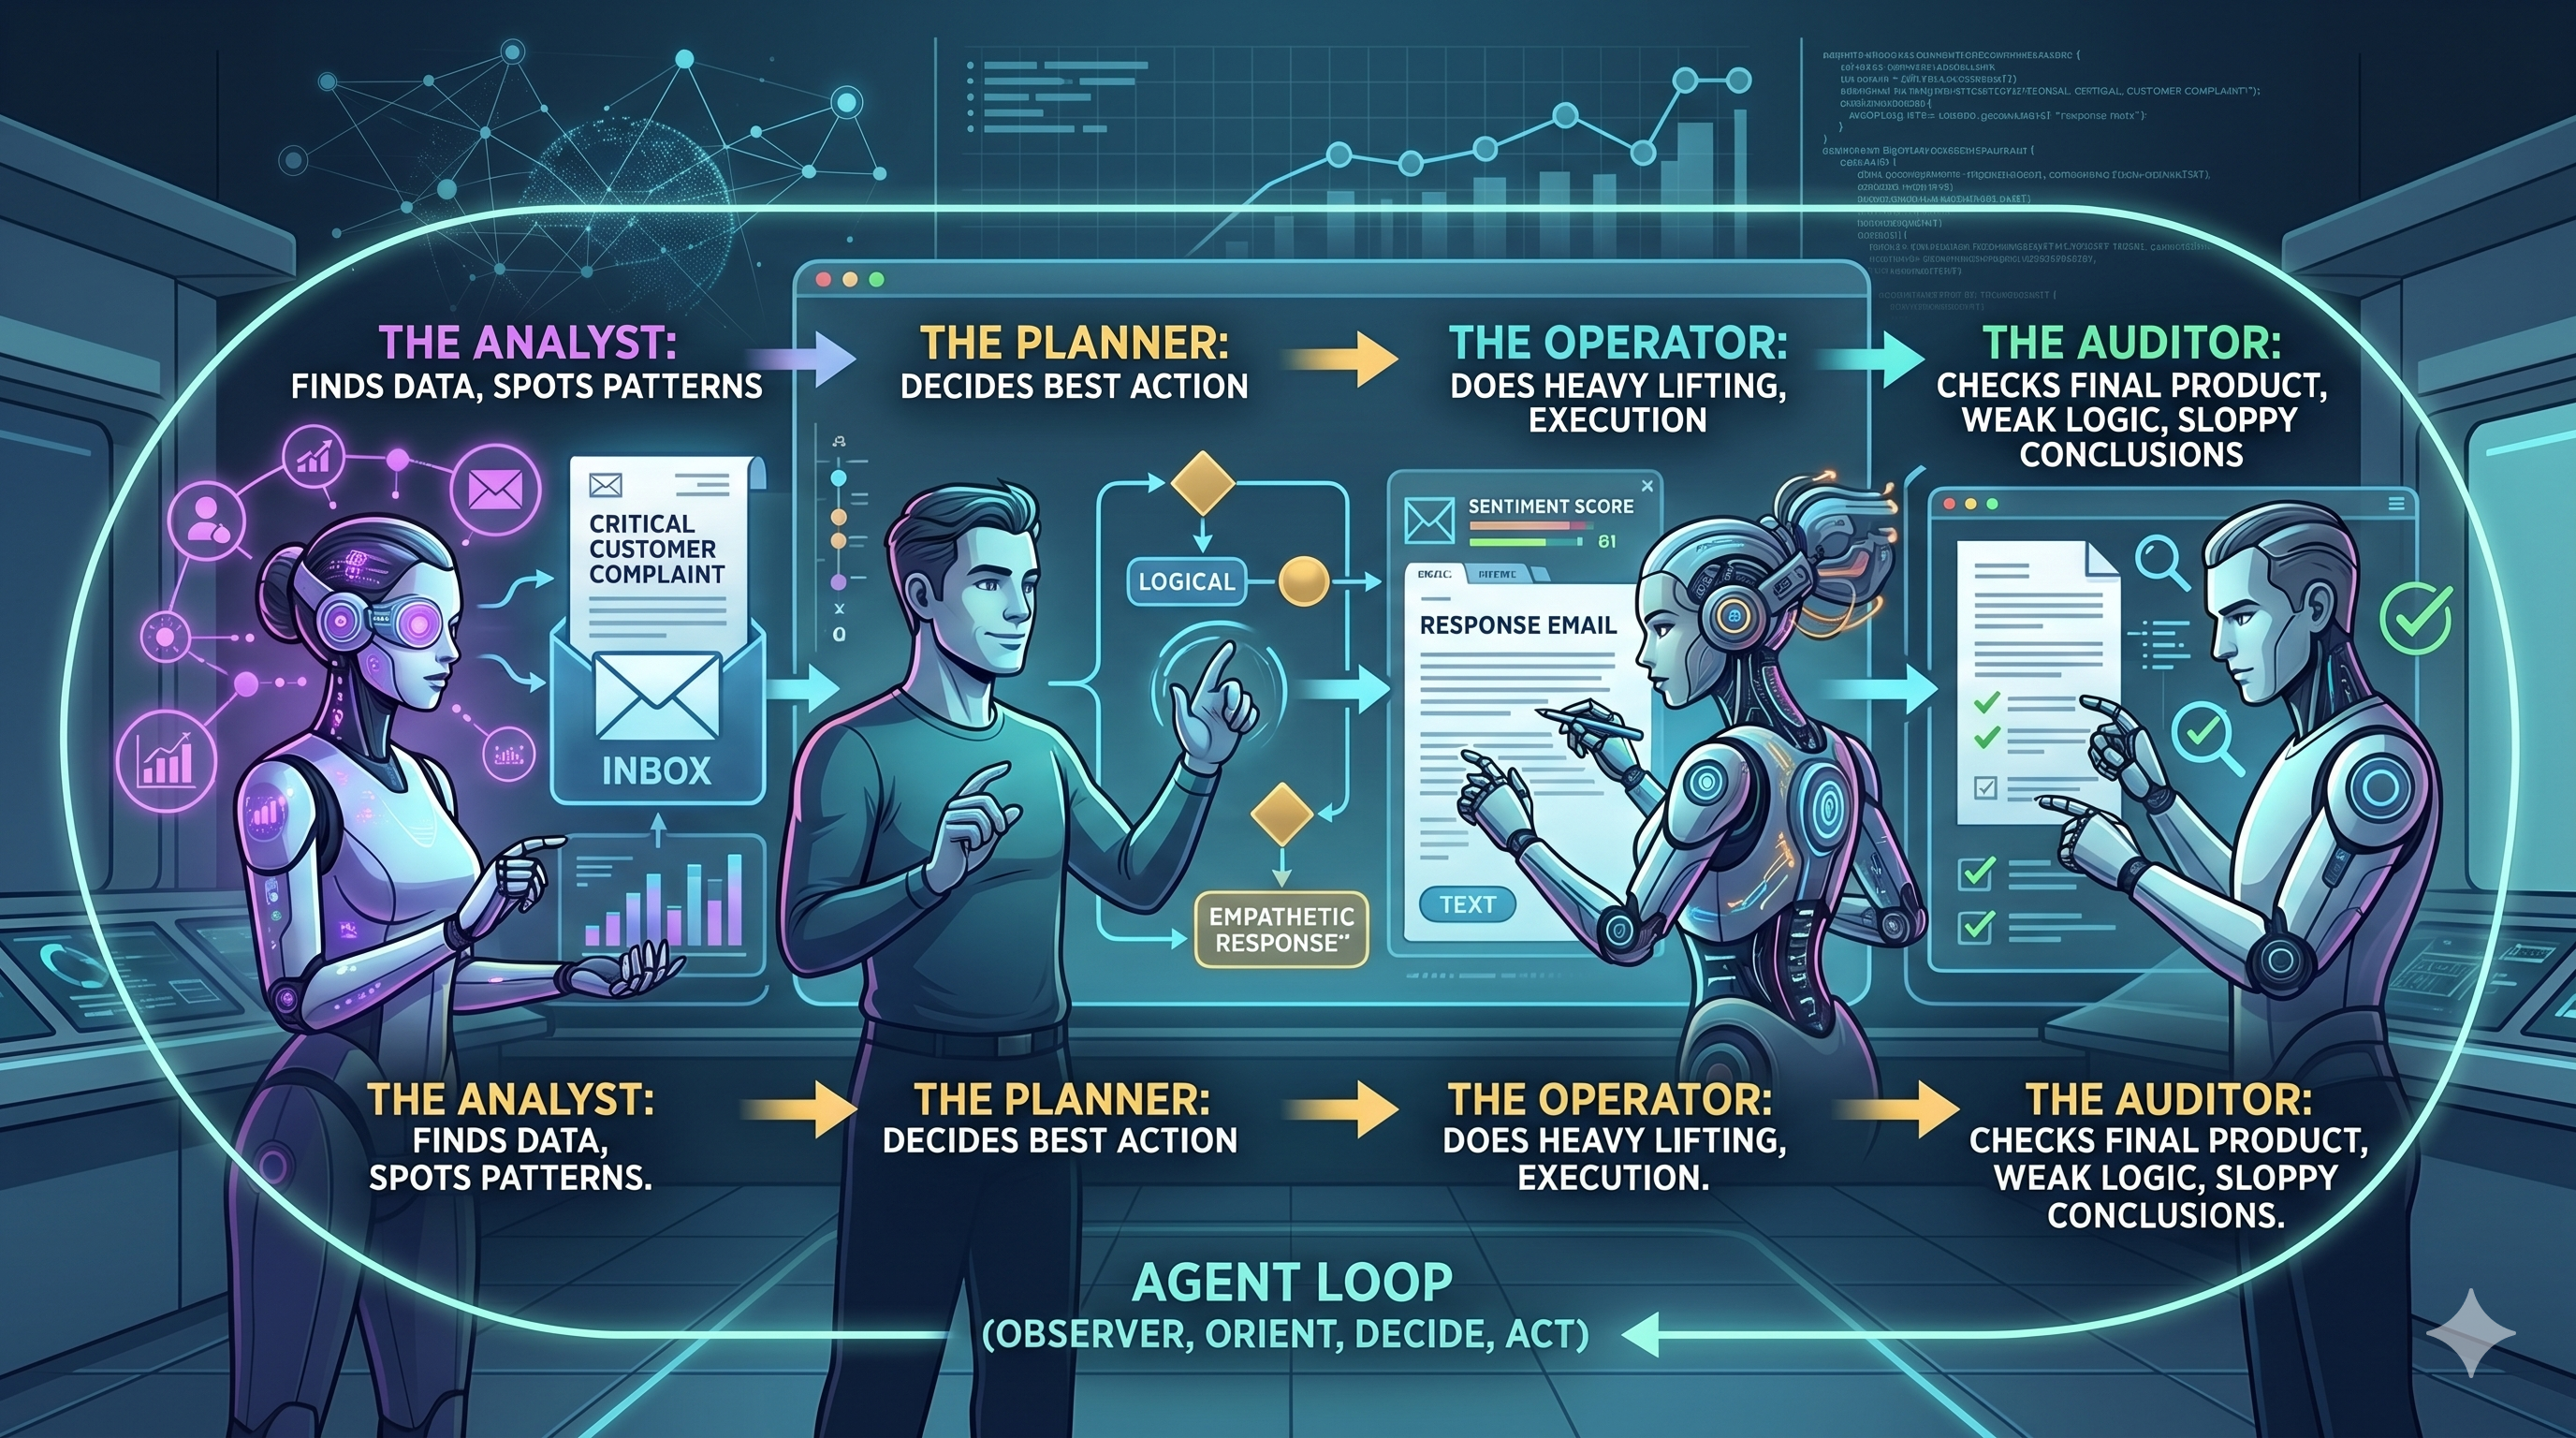
The Analyst: Finds the data and spots the underlying patterns.
The Planner: Decides the best course of action.
The Operator: Does the actual heavy lifting and execution.
The Auditor: Checks the final product for weak logic or sloppy conclusions.
Imagine telling an agent to review your company’s support tickets, sales notes, and product feedback every Monday morning, summarize the three biggest recurring issues, and email a one-page brief to your leadership team.
You didn’t write the report. You didn’t analyze the data. You just assigned the jobs of four traditional team roles to a single agent.
The OODA Loop: Why Agents Don’t Just Break
Disclaimer: I use OODA for pretty much everything in my daily work when it comes to making signficant decisions – its great for Cloud Achitecture to.
What makes agents truly revolutionary is their ability to adapt when things inevitably go wrong.
Back in the 1970s, Air Force Colonel John Boyd studied a fascinating puzzle from the Korean War. American pilots in F86 jets consistently beat Soviet MiGs, even though the MiGs were technically superior—they were faster and could climb higher.
Boyd discovered that American pilots had better visibility from their cockpits, allowing them to adapt faster. He conceptualized this as the OODA Loop: Observe, Orient, Decide, Act.
Traditional automated workflows are completely obedient, which means they are incredibly brittle. If you build a standard automated workflow to order your groceries every Friday, it works perfectly—until your favorite steak is out of stock and you suddenly have six friends coming over for dinner on Saturday. The workflow breaks because it can’t think.
An agent enters its own UODA loop:
Observe: Sees the usual item is out of stock.
Orient: Scans your calendar, notices the dinner party for six.
Decide: Calculates that a substitute protein is needed and scales up the quantities.
Act: Rebuilds and places the modified order.
The Leadership Test: When someone tells you they’ve built an “agent,” ask them one question: When the first path breaks, does it keep blindly following the script, or does it find a better way?
The Catch: AI Won’t Fix Bad Management
Here is the dangerous truth that tech evangelists won’t tell you: An agent will do the wrong thing faster and with more confidence than a human ever could.
AI is not magic; it is a multiplier. If you feed an agent vague goals, sloppy directions, and zero feedback loops, it will drive your corporate car straight into a tree at 100 miles per hour—and send you a beautifully formatted report about the crash.
Most AI problems are actually human management problems in disguise. AI doesn’t fix bad operational thinking; it formalizes it.
Before you hand the keys over to an agent, you must run my GPS Check:
G – Goal: Can you define the ultimate objective clearly in a single sentence?
P – Proof: Do you know exactly what “good” looks like, and how you will verify the agent got it right?
S – Steps: Can you map out the required workflow without any vague hand-waving?
If you can’t clearly define the work, an agent cannot execute it. The winners of this era won’t be the prompt engineers; they will be the leaders who understand their business deeply enough to define it precisely.
The Future Belongs to the Narrow (And the Tasteful)
Right now, the corporate world is obsessed with “broad AI solutions.” Everyone wants AI everywhere, instantly.
But the companies actually winning are doing the exact opposite: they are staying obsessively narrow.
I recently watched a product demo for a construction software company. They didn’t show off a giant, all-knowing corporate AI. Instead, they launched a beta agent designed to do one thing: collect field data for a highly specific type of contractor in a highly specific scenario.
When the demo ended, every single phone in the room went up to scan the QR code. Why? Because it solved a highly specific, deeply painful task that people had hated doing for decades.
Find the boring, repetitive, highly specific task that your team absolutely detests—that is where the immediate ROI is.
Your Value as a Leader Is Shifting
We are entering an era of infinite output. Code, content, and basic data analysis are becoming incredibly cheap commodities.
But when intelligence becomes cheap, human judgment becomes exceptionally expensive. When output becomes infinite, taste becomes scarce.
AI is decoupling your income from your hours. For the first time in history, you aren’t trading time for decisions; you are scaling your judgment.
The most valuable leader in the room is no longer the one who can think or execute the fastest. It’s the leader who can define what good work looks like, spot bad work instantly, and know exactly when to trust the agent—and when to trust the human.
For the past two years, the conversation around AI has been dominated by the “Copilot” paradigm. We have focused on efficiency: developers typing faster, analysts summarizing emails, and engineers generating boilerplate code. While this has delivered incremental productivity gains, it has also trapped many organizations in a cycle of “task-level” automation.
As we move into the second half of 2026, the strategic imperative is shifting. We are moving from Copilots—which assist humans with tasks—to Agents, which drive outcomes.
The Limitation of the Copilot Era
The Copilot model was a transitionary phase. It relied on a “Human-in-the-Loop” for every action. If you wanted to deploy a service, you prompted the LLM, reviewed the code, executed the CI/CD pipeline, and monitored the metrics. You were still the architect, the operator, and the quality assurance layer.
This model excels at efficiency (doing things right), but it fails at agility (doing the right things at scale). It creates a “fragmented automation” debt where your technical team spends more time managing individual AI interactions than actually optimizing the business logic of the enterprise.
The Security “Scapegoat” and the Ferrari Paradox
Ironically, while the industry talks about AI-driven transformation, many leaders—particularly in public companies—are effectively “shooting themselves in the foot.”
I have witnessed CEOs and executives ban the use of AI for fundamental tasks like meeting recording and synthesis, citing security risks. They label it a “public company data risk,” effectively treating AI like a forbidden technology.
This is like driving a Ferrari like a bicycle.
By banning these tools, leaders stifle productivity and slash potential ROI. They use security as a scapegoat to avoid the friction of learning a new operating model. The reality is that the risk profile of an AI-powered meeting tool is fundamentally similar to the risks inherent in standard digital tools (email, cloud storage, collaboration platforms).
The irony is profound: the biggest security threat to your organization is rarely AI exfiltration; it is the stagnation of your workforce and the loss of institutional knowledge. Security should be managed through risk mitigation, governance, and compliance—not prohibition.
The Agentic Operating Model: A Strategic Pivot
The “Agentic Shift” is not about faster typing; it is about architectural autonomy. An Agentic Operating Model shifts the responsibility of execution from the individual engineer to an orchestrated, goal-driven agentic ecosystem.
In this model, you don’t ask an AI to “write this function.” You define the Outcome: “Our time-to-market for this module is 48 hours; ensure the deployment, security compliance, and testing pass the current production benchmarks.”
The agentic system then plans, executes, and iterates. It acts as an extension of the technical leadership’s intent, operating within the guardrails established by your governance and infrastructure.
How Public Companies Can Adopt AI Safely
Public companies do not need to ban AI; they need to operationalize it with rigor. Here is how leaders can mitigate risk while maintaining velocity:
Shift from Prohibition to Governance: Treat AI like any other enterprise software. Implement policy-driven access controls, data classification, and logging. If your current security posture can handle corporate email, it can be adapted to handle AI-augmented workflows.
Invest in “AI Literacy” Training: Just as you train staff on phishing, anti-bribery, and data privacy, you must train them on the responsible use of AI. Teach them what data can go into an LLM and what cannot.
Deploy Private/Controlled Environments: Utilize enterprise-grade AI instances where data residency and confidentiality are contractually guaranteed. This eliminates the “leakage” fear while providing the utility of advanced models.
Governance-as-Code: Use your existing infrastructure (like Kubernetes-based policy engines) to enforce guardrails on AI interaction, ensuring that agents only have the permissions they absolutely need.
Why this matters for the Head of Technology
For leaders overseeing cloud modernization and digital transformation, the implications are profound:
From Managing People to Managing Intent: Your role shifts from managing daily developer cycles to defining the “intent-space” in which agents operate. Your expertise in Kubernetes, GitOps, and platform architecture becomes the foundational safety layer that allows agents to operate at speed without creating production incidents.
Architectural Governance as a Moat: In an agentic world, bad infrastructure becomes a massive liability. The companies that win will be those with mature, observable, and immutable infrastructure. My experience in high-reliability systems (AKS, OIDC, Dynatrace) is exactly what’s needed to build the stable “control plane” that agentic teams require to scale.
Outcome-Based Budgeting: We move away from measuring “lines of code” or “number of PRs” to measuring the successful completion of strategic business outcomes. This aligns technical throughput directly with board-level expectations.
The Path Forward
Transitioning to an agentic operating model is not a technical upgrade; it is an organizational one. It requires:
A “Reliability-First” Culture: Treating agentic processes with the same rigor you apply to production deployments.
API-First Thinking: Ensuring your entire tech stack is accessible and interpretable by machine agents.
Strategic Sequencing: Prioritizing automation in the areas that directly impact your organization’s core value stream.
The future isn’t just about using AI. It is about building the systems that make AI a reliable, autonomous, and strategic engine for growth.
The Azure MCP (Model Context Protocol) Server acts as a bridge, allowing AI agents to interact directly with Azure infrastructure using natural language. Instead of struggling with complex CLI syntax to query Azure Kubernetes Service (AKS), you can simply “ask” the MCP server to retrieve cluster configurations, list node pools, or check network settings. It simplifies the “how-do-I-do-this” hurdle, allowing you to focus on managing your container workloads through plain English prompts rather than memorizing documentation.
From “Fire in the Datacenter” to “Fixed While You Sleep”
We’ve all been there. It’s 3:00 AM. Your phone buzzes with a high-priority alert. You drag yourself out of bed, fumble for your laptop, and try to remember where you left your sanity.
What if your AI agent—your digital on-call engineer—could handle it instead?
By combining Dynatrace (for observability), Azure MCP (for infrastructure control), and Jira (for tracking), you can move from reactive “firefighting” to autonomous “self-healing.”
The “Auto-Fix” Architecture
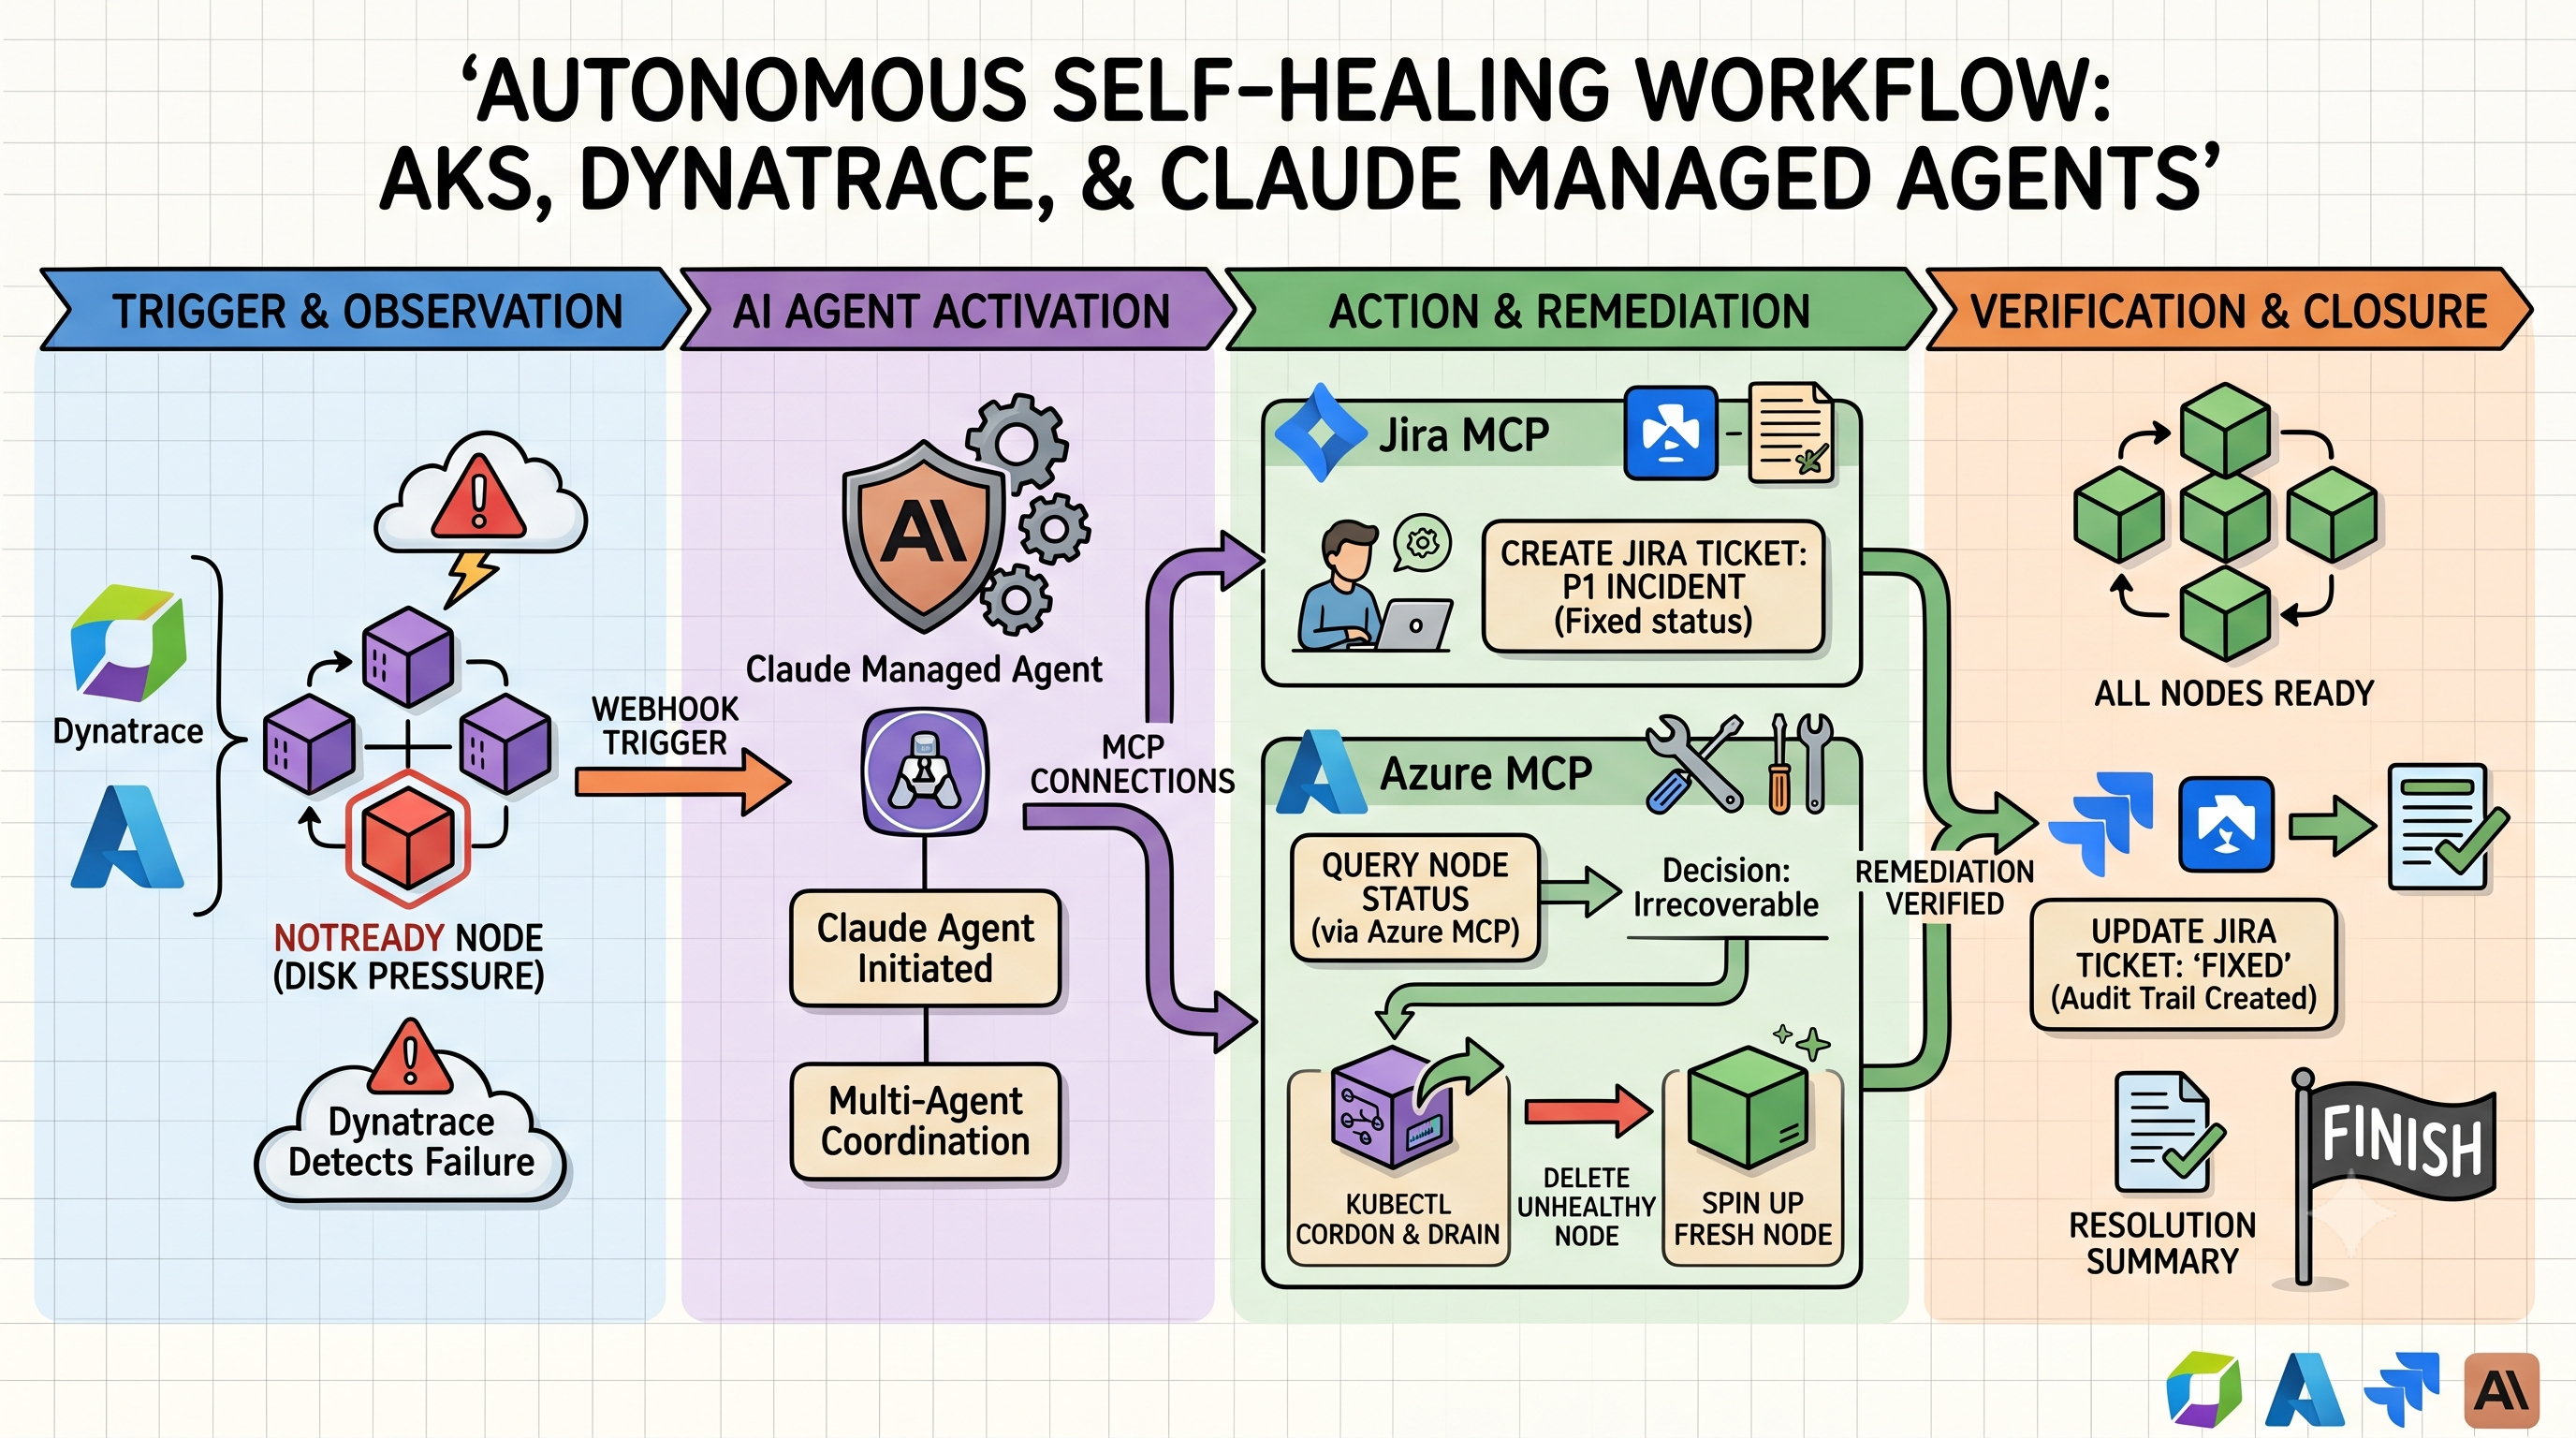
When an “Unhealthy Node” alert fires in AKS, you don’t need to wake up. Here is the workflow:
The Trigger: Dynatrace detects a node in your AKS cluster is reporting NotReady due to disk pressure.
The Agent Wakes Up: A webhook triggers your Claude Managed Agent.
The Documentation: The agent uses the Jira MCP to automatically create a “P1 Incident” ticket, attaching the Dynatrace diagnostic logs.
The Investigation & Action: * The agent uses the Azure MCP to query the specific node pool status.
It determines the node is irrecoverable.
It issues a kubectl cordon and drain command (via the Azure MCP) to safely move workloads.
It deletes the unhealthy node and forces the scale set to spin up a fresh, healthy one.
The Wrap-Up: The agent confirms the node is Ready, adds a comment to the Jira ticket with the “Fixed” status, and moves it to the “Done” column.
Why this is a game-changer
It isn’t just about speed; it’s about consistency. Humans get tired, stressed, and prone to “copy-paste” errors at 3 AM. An AI agent follows a predefined rubric. If the first attempt to drain the node fails, it doesn’t panic—it reads the error code, adjusts the strategy, and tries again.
And because you have the Jira MCP hooked into the loop, you always have an audit trail. You can wake up at 8 AM, have your coffee, and read a neat summary of exactly what the agent did while you were dreaming about a vacation from on-call duty.
The future isn’t just “no ops.” It’s “AI-ops.” You define the boundaries, you define the rules, and the agent keeps the ship running while you get some actual sleep.
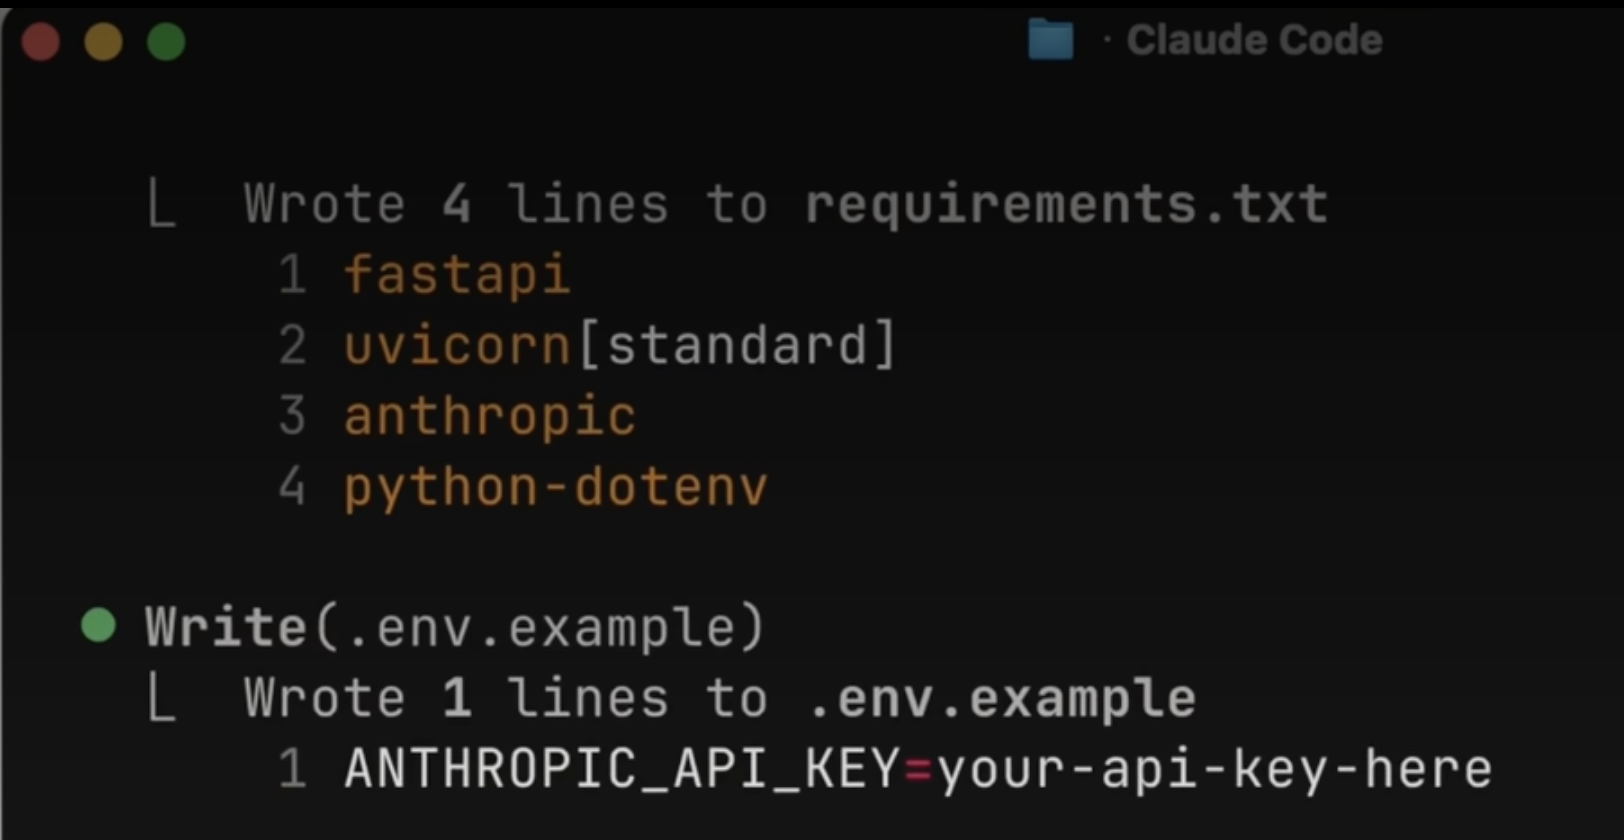
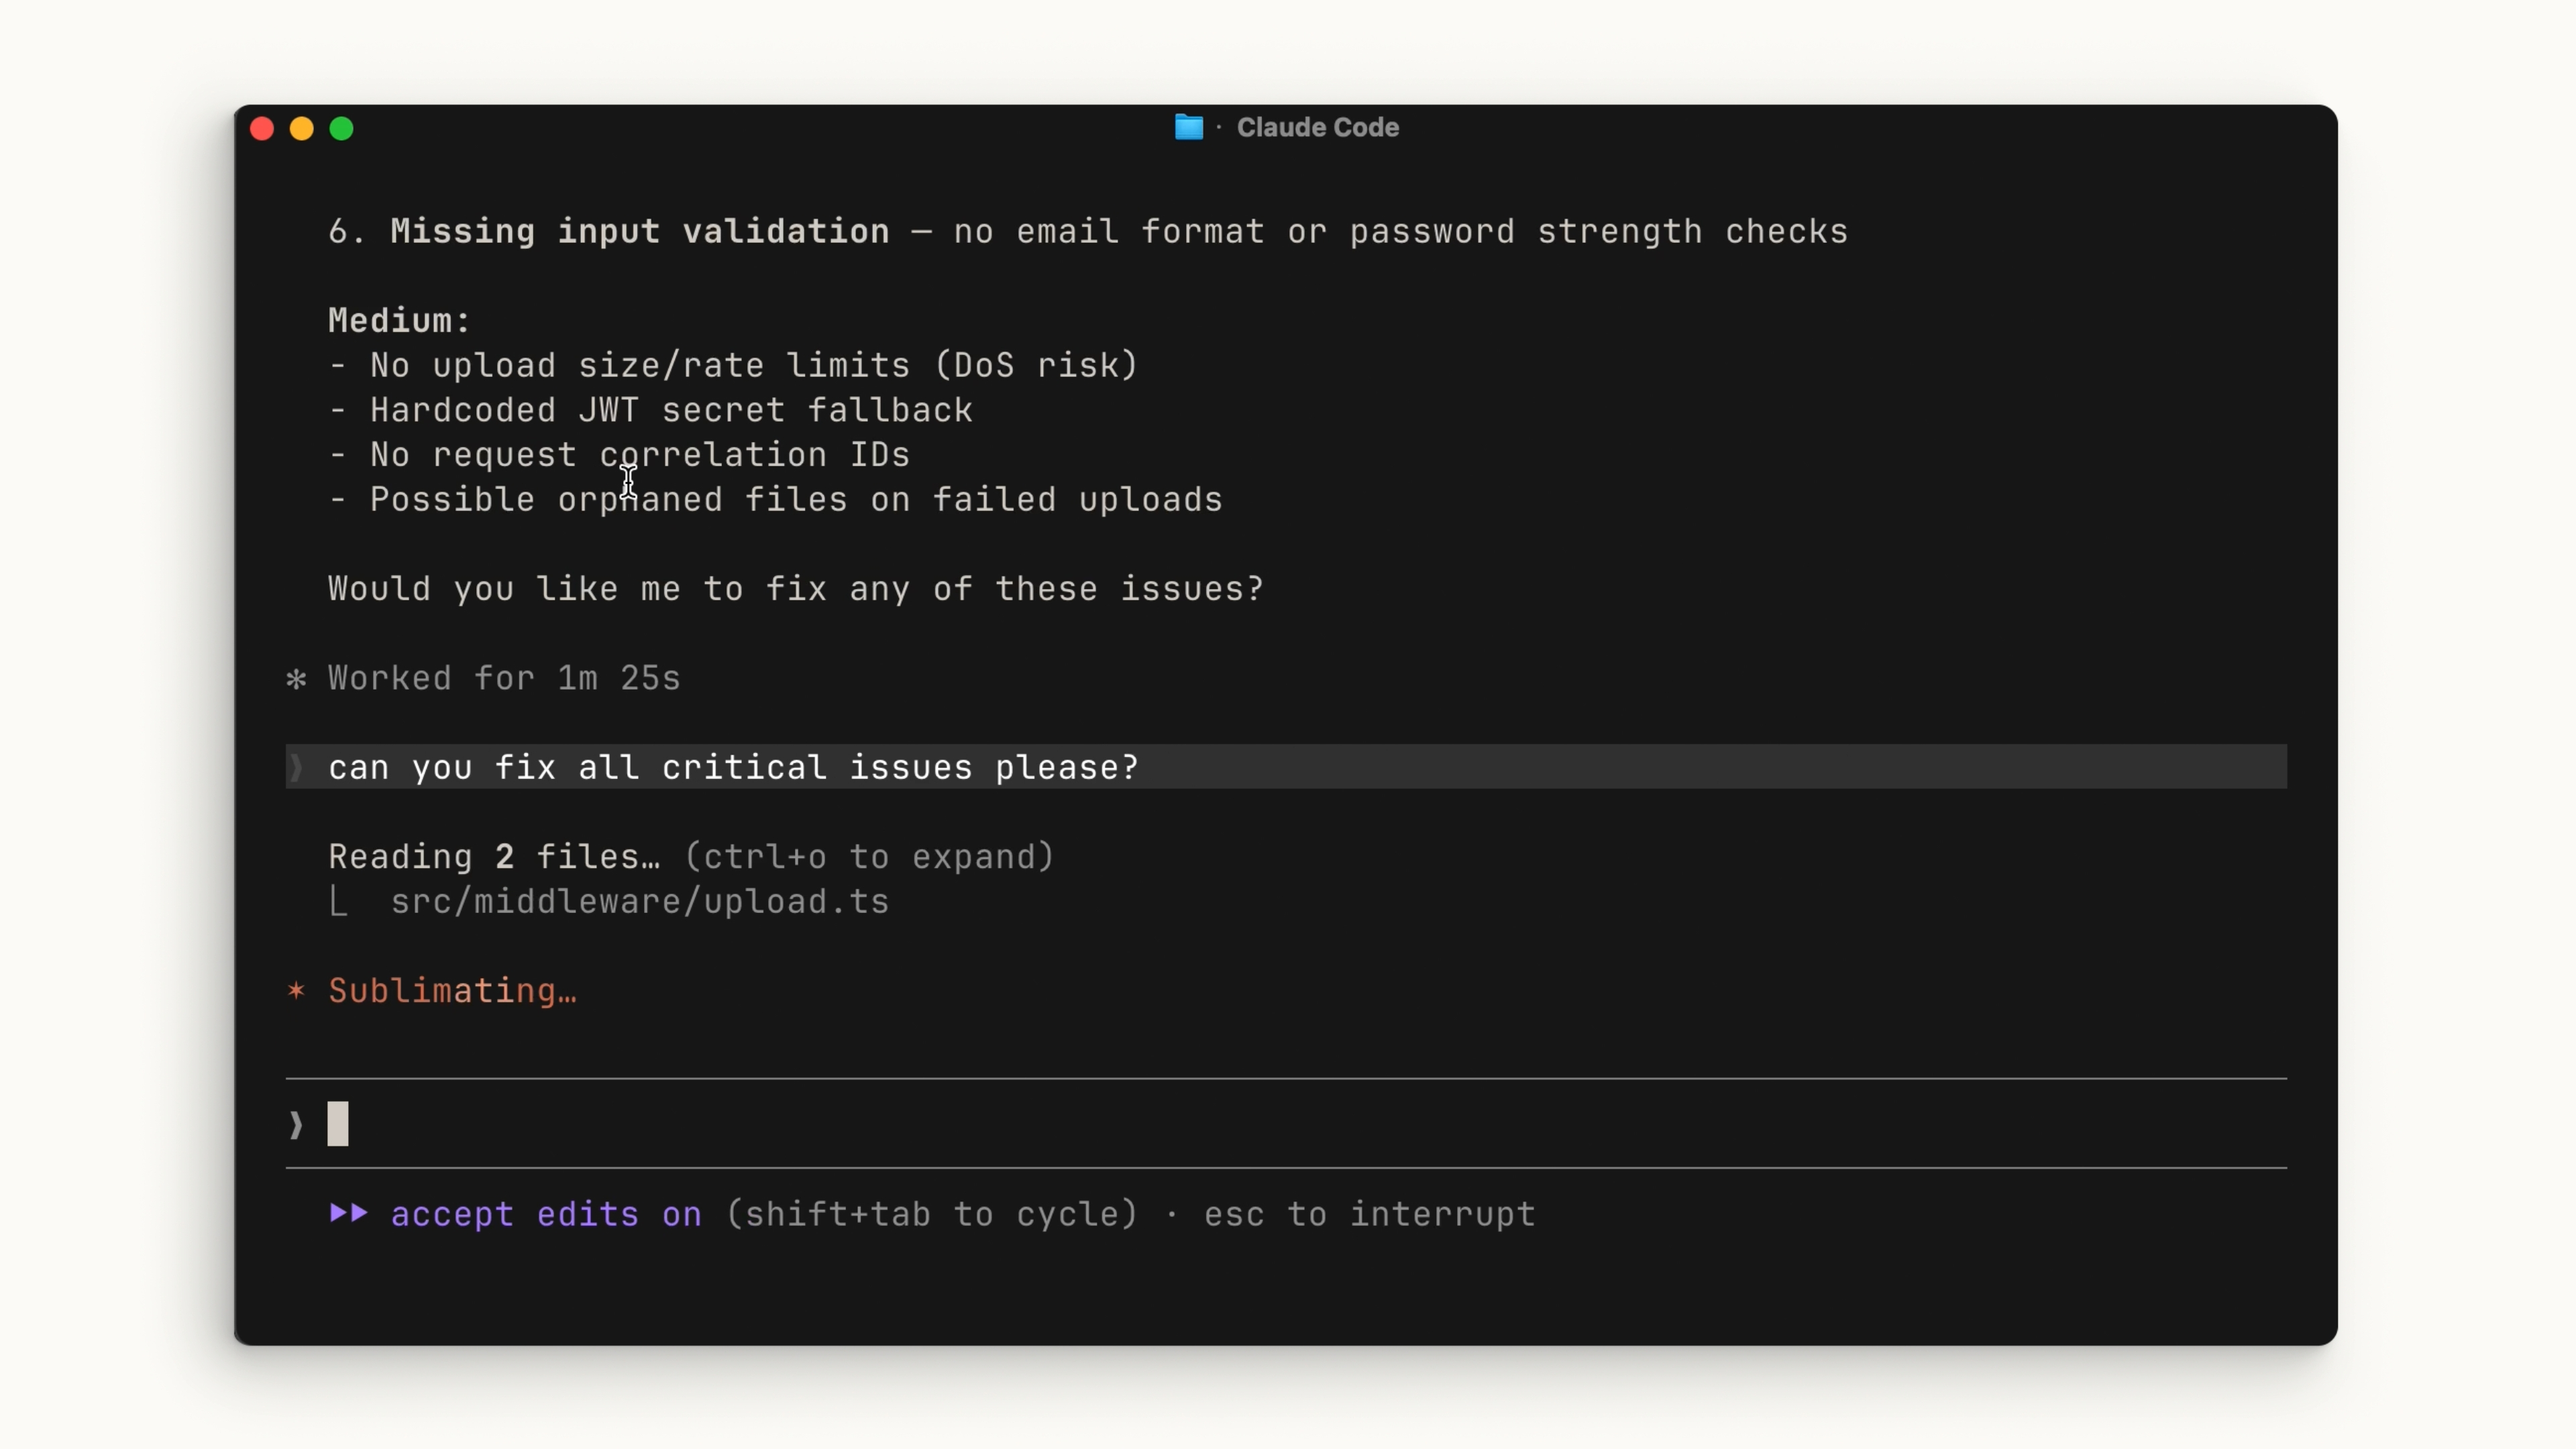
Let’s be real: most AI coding assistants are glorified autocomplete engines that require you to copy-paste code like it’s 2005. Claude Code is different. It’s an agentic coding tool that lives in your terminal, understands your actual codebase, executes commands, and—here is the kicker—does the work for you.
It doesn’t just suggest a function; it writes the function, runs the tests, fixes the inevitable “oops,” and commits the result.
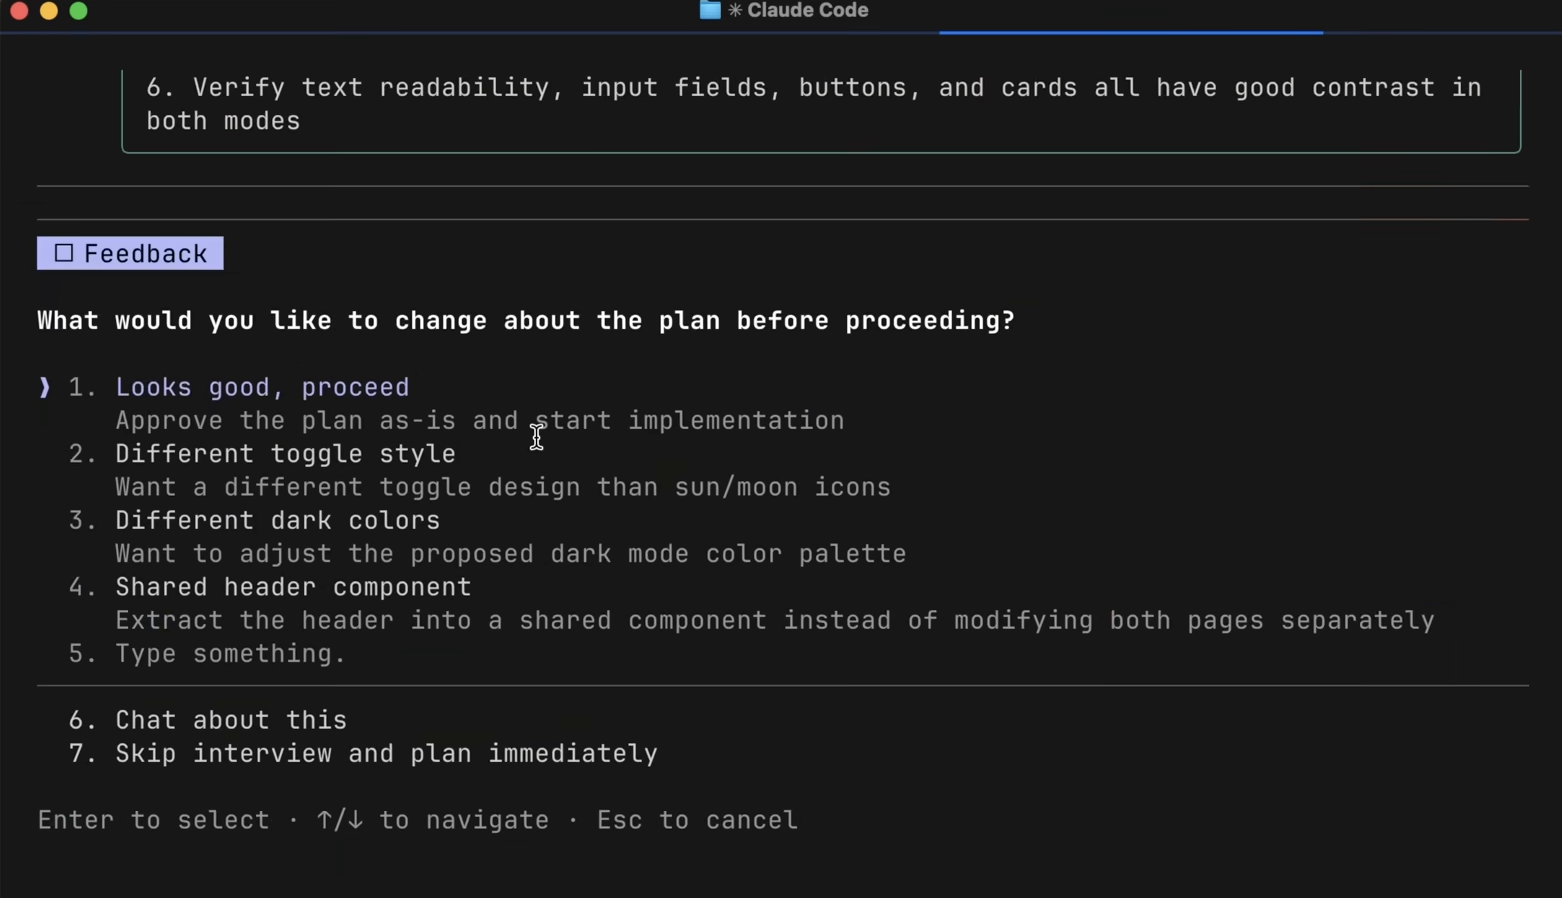
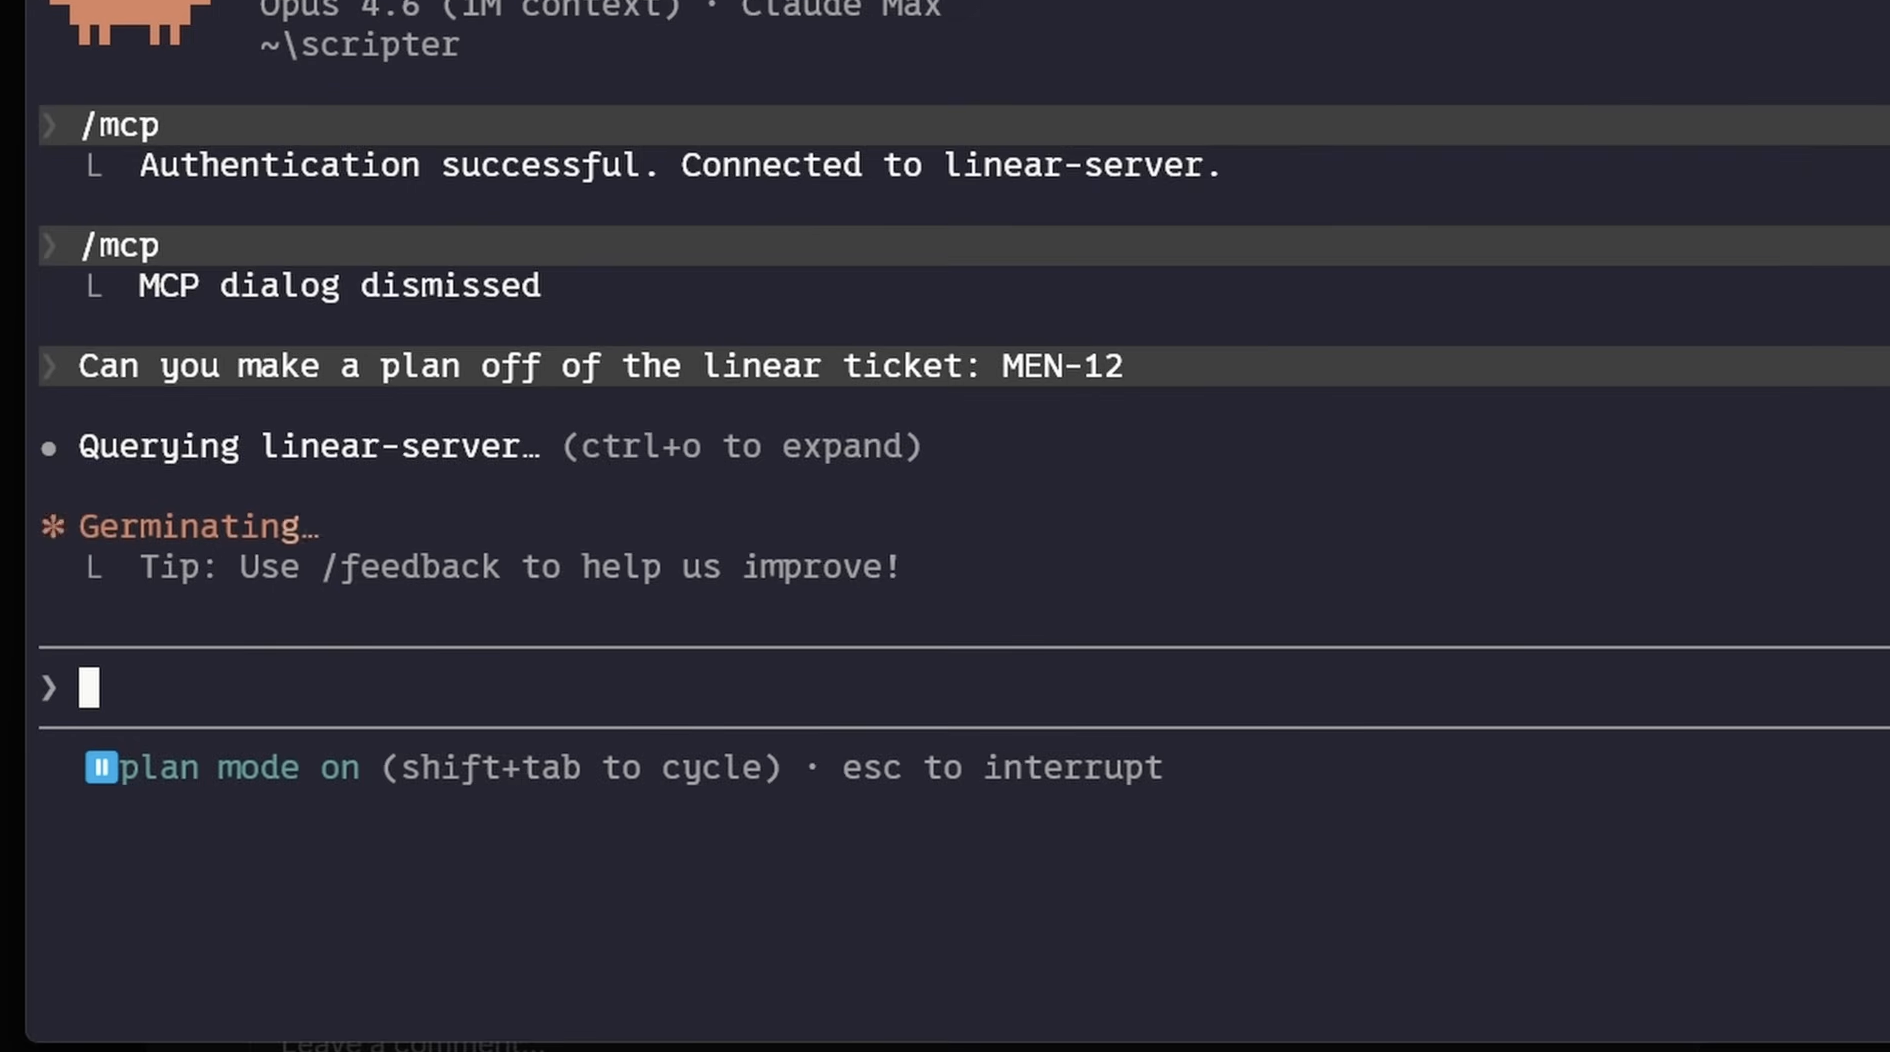
The “Must-Know” Workflow: Explore → Plan → Code → Commit If you jump straight to asking Claude to “write code,” you’re setting yourself up for a chaotic debugging session. Instead, embrace the Explore → Plan → Code → Commit rhythm:
Explore & Plan: Use Plan Mode (Shift + Tab). Claude reads your files (read-only!) and builds a map. It’s like giving your GPS a destination before you start driving.
Code: Once the plan is approved, Claude executes. It’s your pair programmer—but the kind that doesn’t complain about your coffee habits.
Commit: Use built-in subagents to review your work before you push. It’s like having a senior dev check your PR without the existential dread of a code review meeting.
Supercharging Your Workflow (Without Killing Your Context)
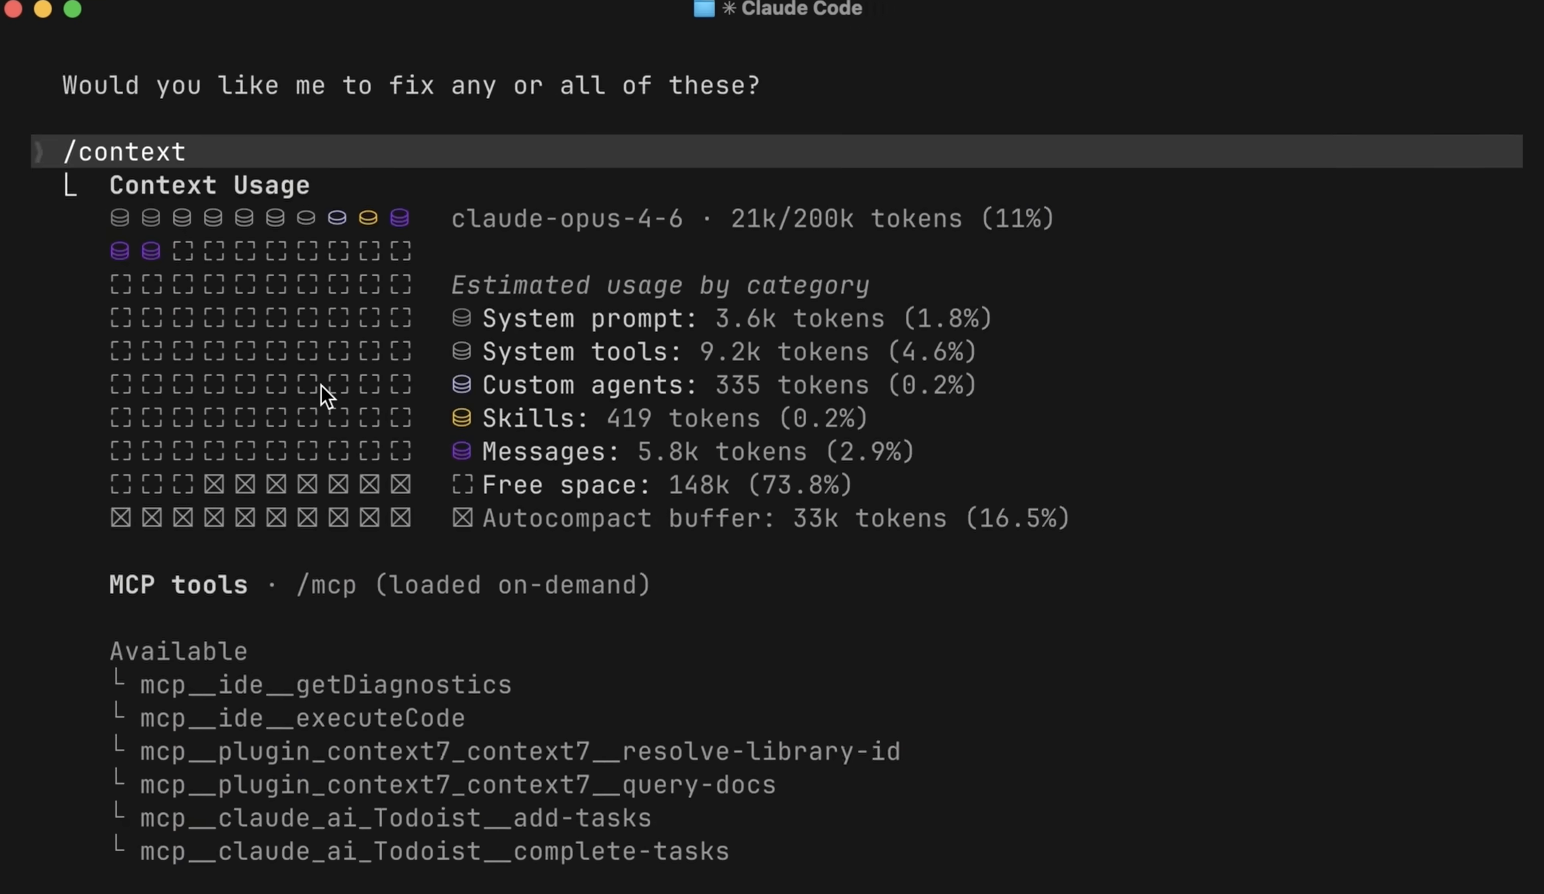
The biggest challenge with any agent is the Context Window. You have a finite amount of space in Claude’s “brain,” and if you fill it with irrelevant garbage, Claude gets “dumb.” Here is how to keep it sharp:
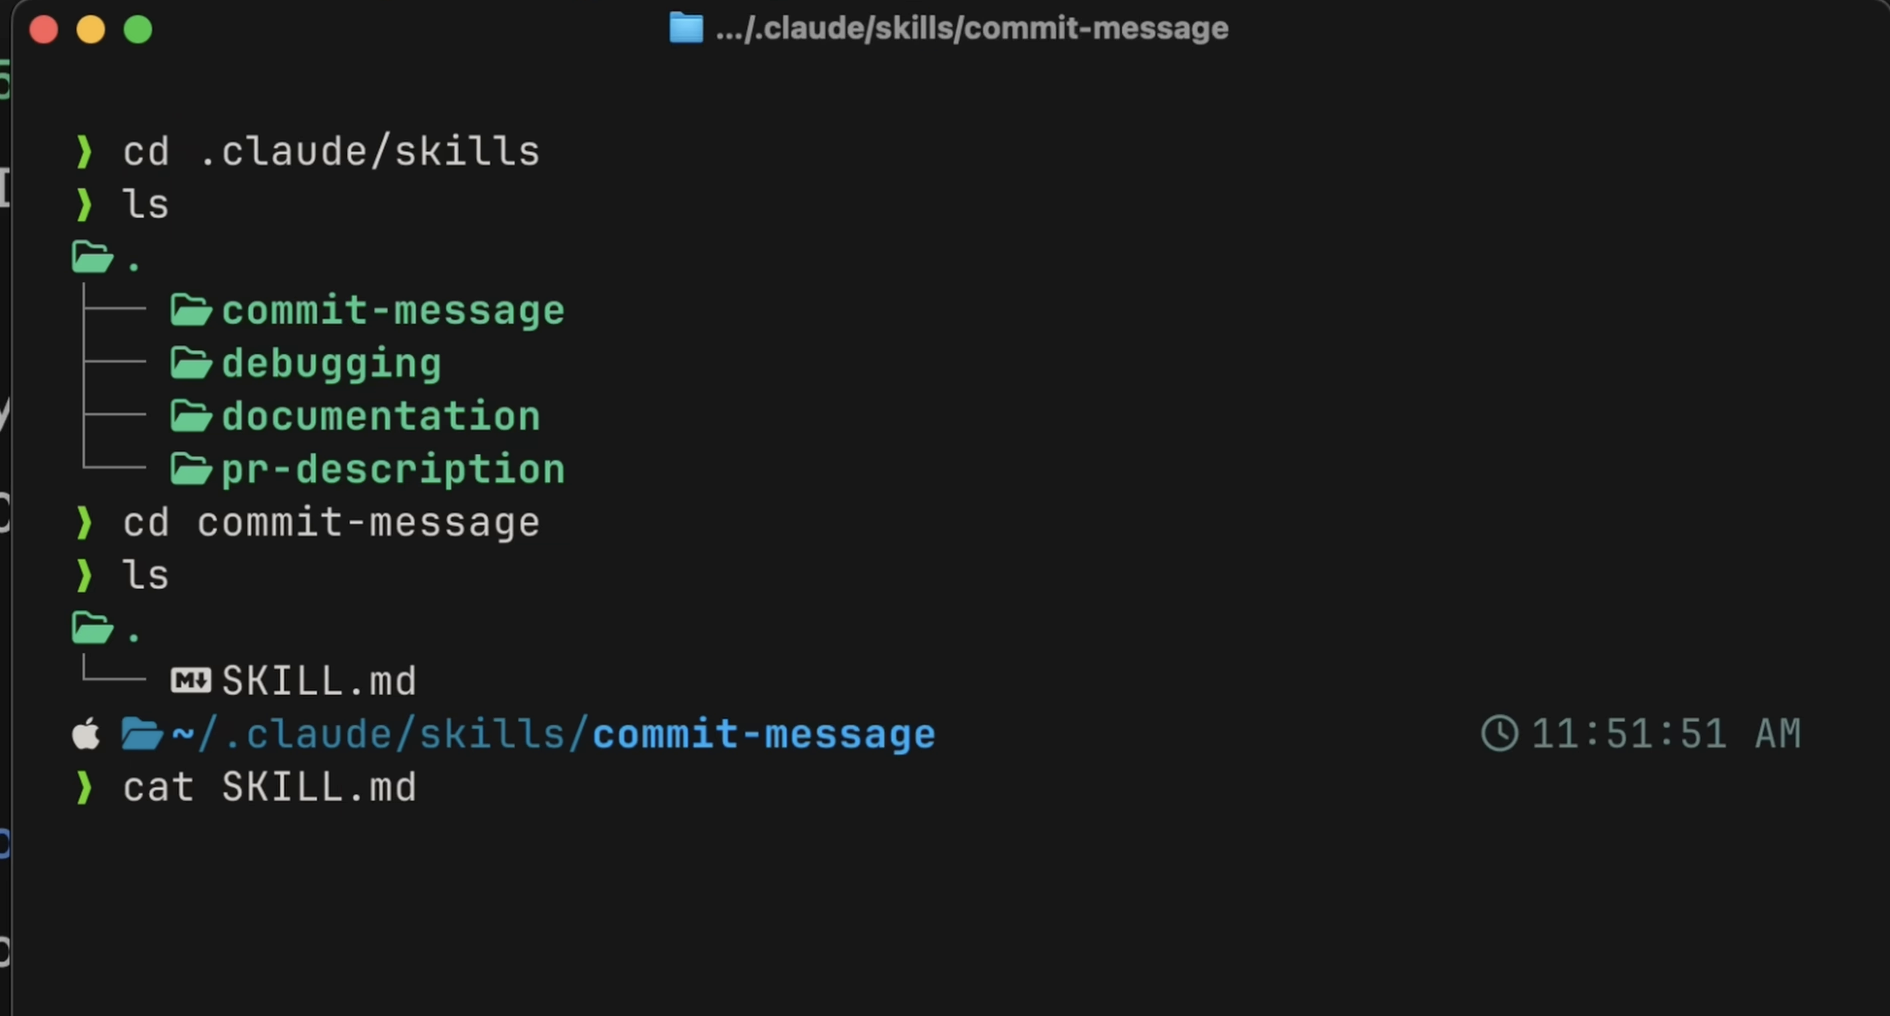
1. Skills > MCP
Think of Skills as your AI’s muscle memory. Whether it’s a specific TDD workflow or a custom PR template, Skills only load the heavy instructions when they are needed.
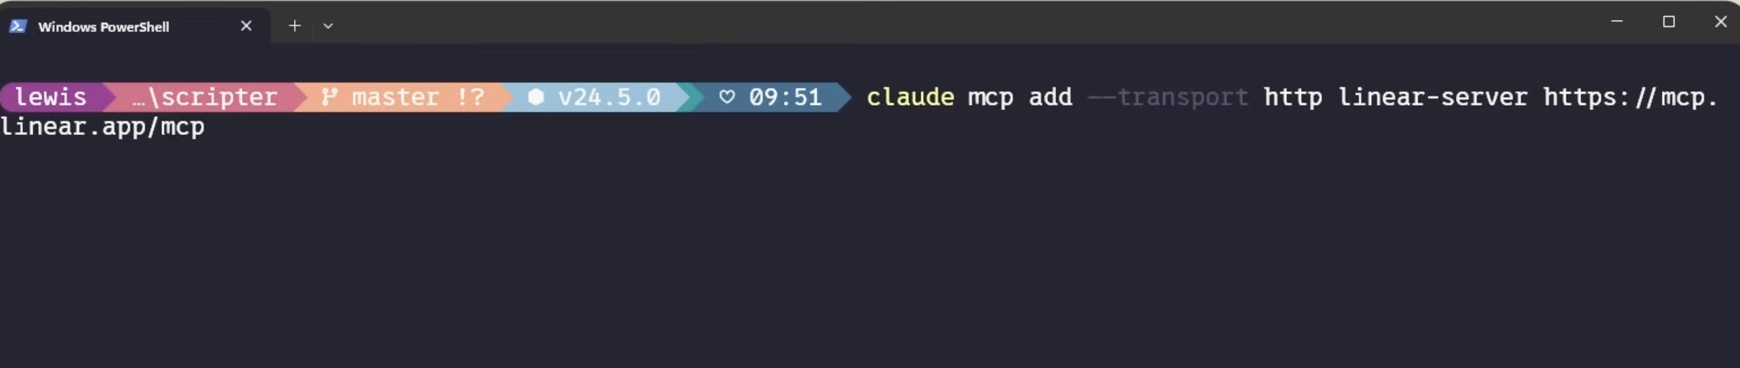
Pro-tip: Don’t overuse MCP servers. They load tool definitions into context permanently. If a tool has a CLI equivalent (like gh for GitHub), use the CLI—it’s way more efficient. Try to keep your MCP footprint under 10% of your context window, or Claude will start struggling.
2. Deterministic Power: Hooks
If you want something to happen every single time, don’t ask Claude to remember it in a prompt (it’ll eventually forget). Use Hooks.
PostToolUse: Perfect for auto-formatting (e.g., running Prettier after every edit).
PreToolUse: Your “Do Not Touch” switch. Block rm -rf or production file edits.
Humor Note: Treat these hooks like your stern office manager—they don’t care about your “intent,” they just enforce the rules.
3. The Holy Grail: CLAUDE.md
If your project feels like it’s suffering from amnesia, create a CLAUDE.md file. It’s the “Onboarding Guide” for your agent. If you find yourself correcting Claude twice on the same thing, tell it to “save this rule to CLAUDE.md.” It’s basically teaching your AI to grow up.
Final Thoughts
Claude Code is essentially a super-powered intern that never sleeps. By managing your context, relying on deterministic Hooks for safety, and using Skills for reusable workflows, you stop fighting the tool and start shipping code.
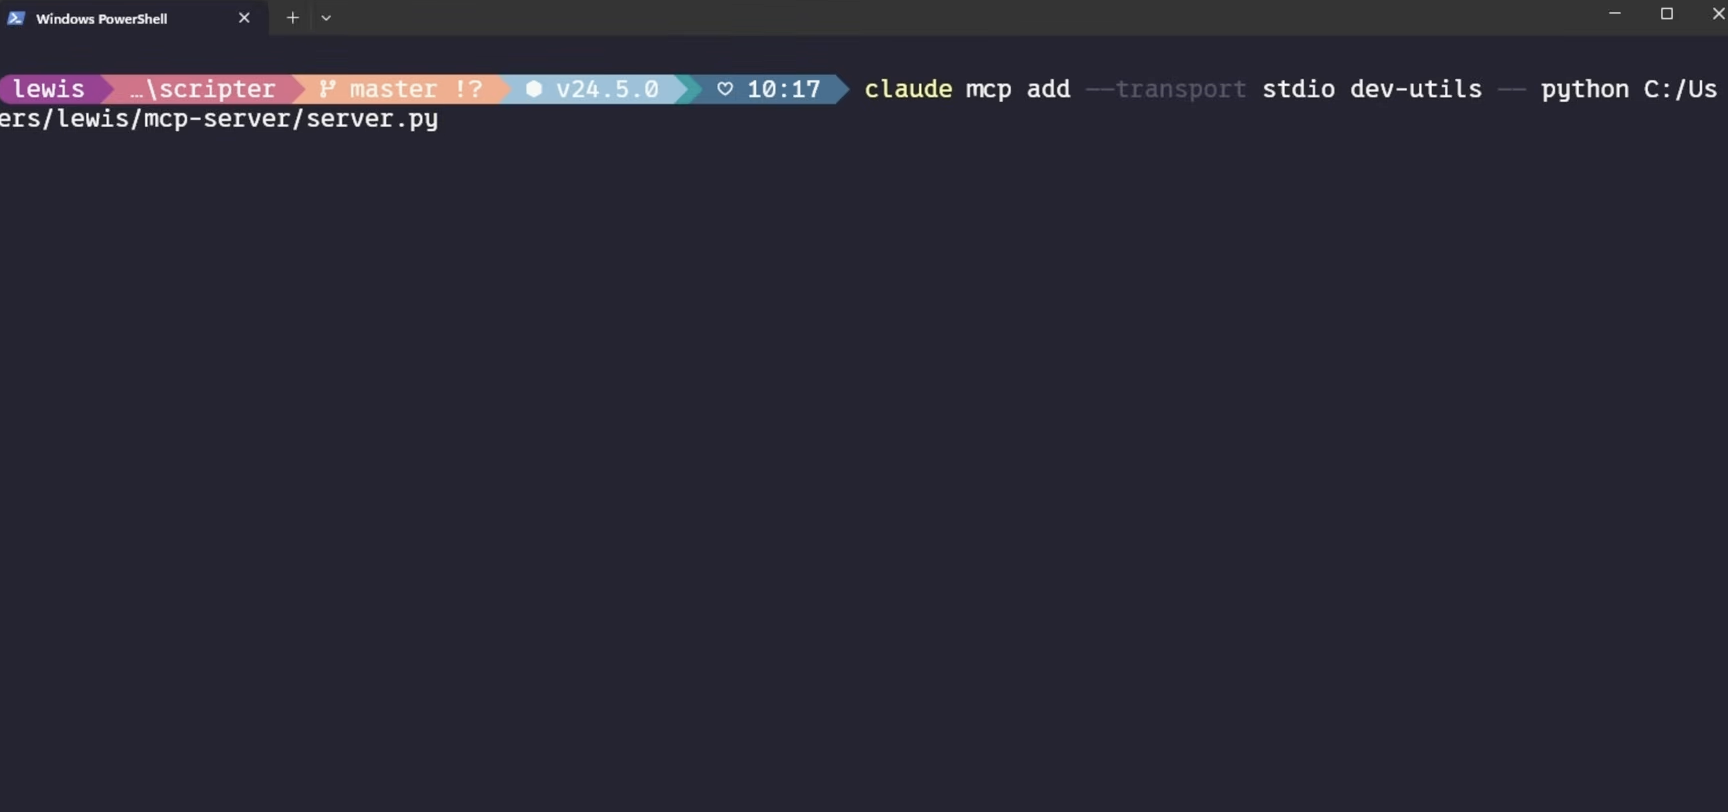
Now, go forth, run claude, and try not to let the AI take too much credit for your genius.
If you’ve spent the last 25 years navigating the evolution of software engineering—from bare-metal servers to the complexity of Kubernetes clusters and multi-cloud architectures—you know that the “dev” in DevOps has always been about abstraction.
We moved from manual scripts to Terraform (IaC), from manual deployments to GitOps (ArgoCD), and from siloed monitoring to observability stacks. Every step was about making our systems more predictable, repeatable, and scalable.
Today, we are hitting the next wall: The “Context Gap.” Even with the best AI coding assistants, there is a disconnect between the LLM’s general knowledge and the specific, idiosyncratic realities of your internal platforms, APIs, and business data.
Enter the Model Context Protocol (MCP). If you’ve spent your career building pipelines to get code into production, think of MCP as the pipeline to get intelligence into your development workflow.
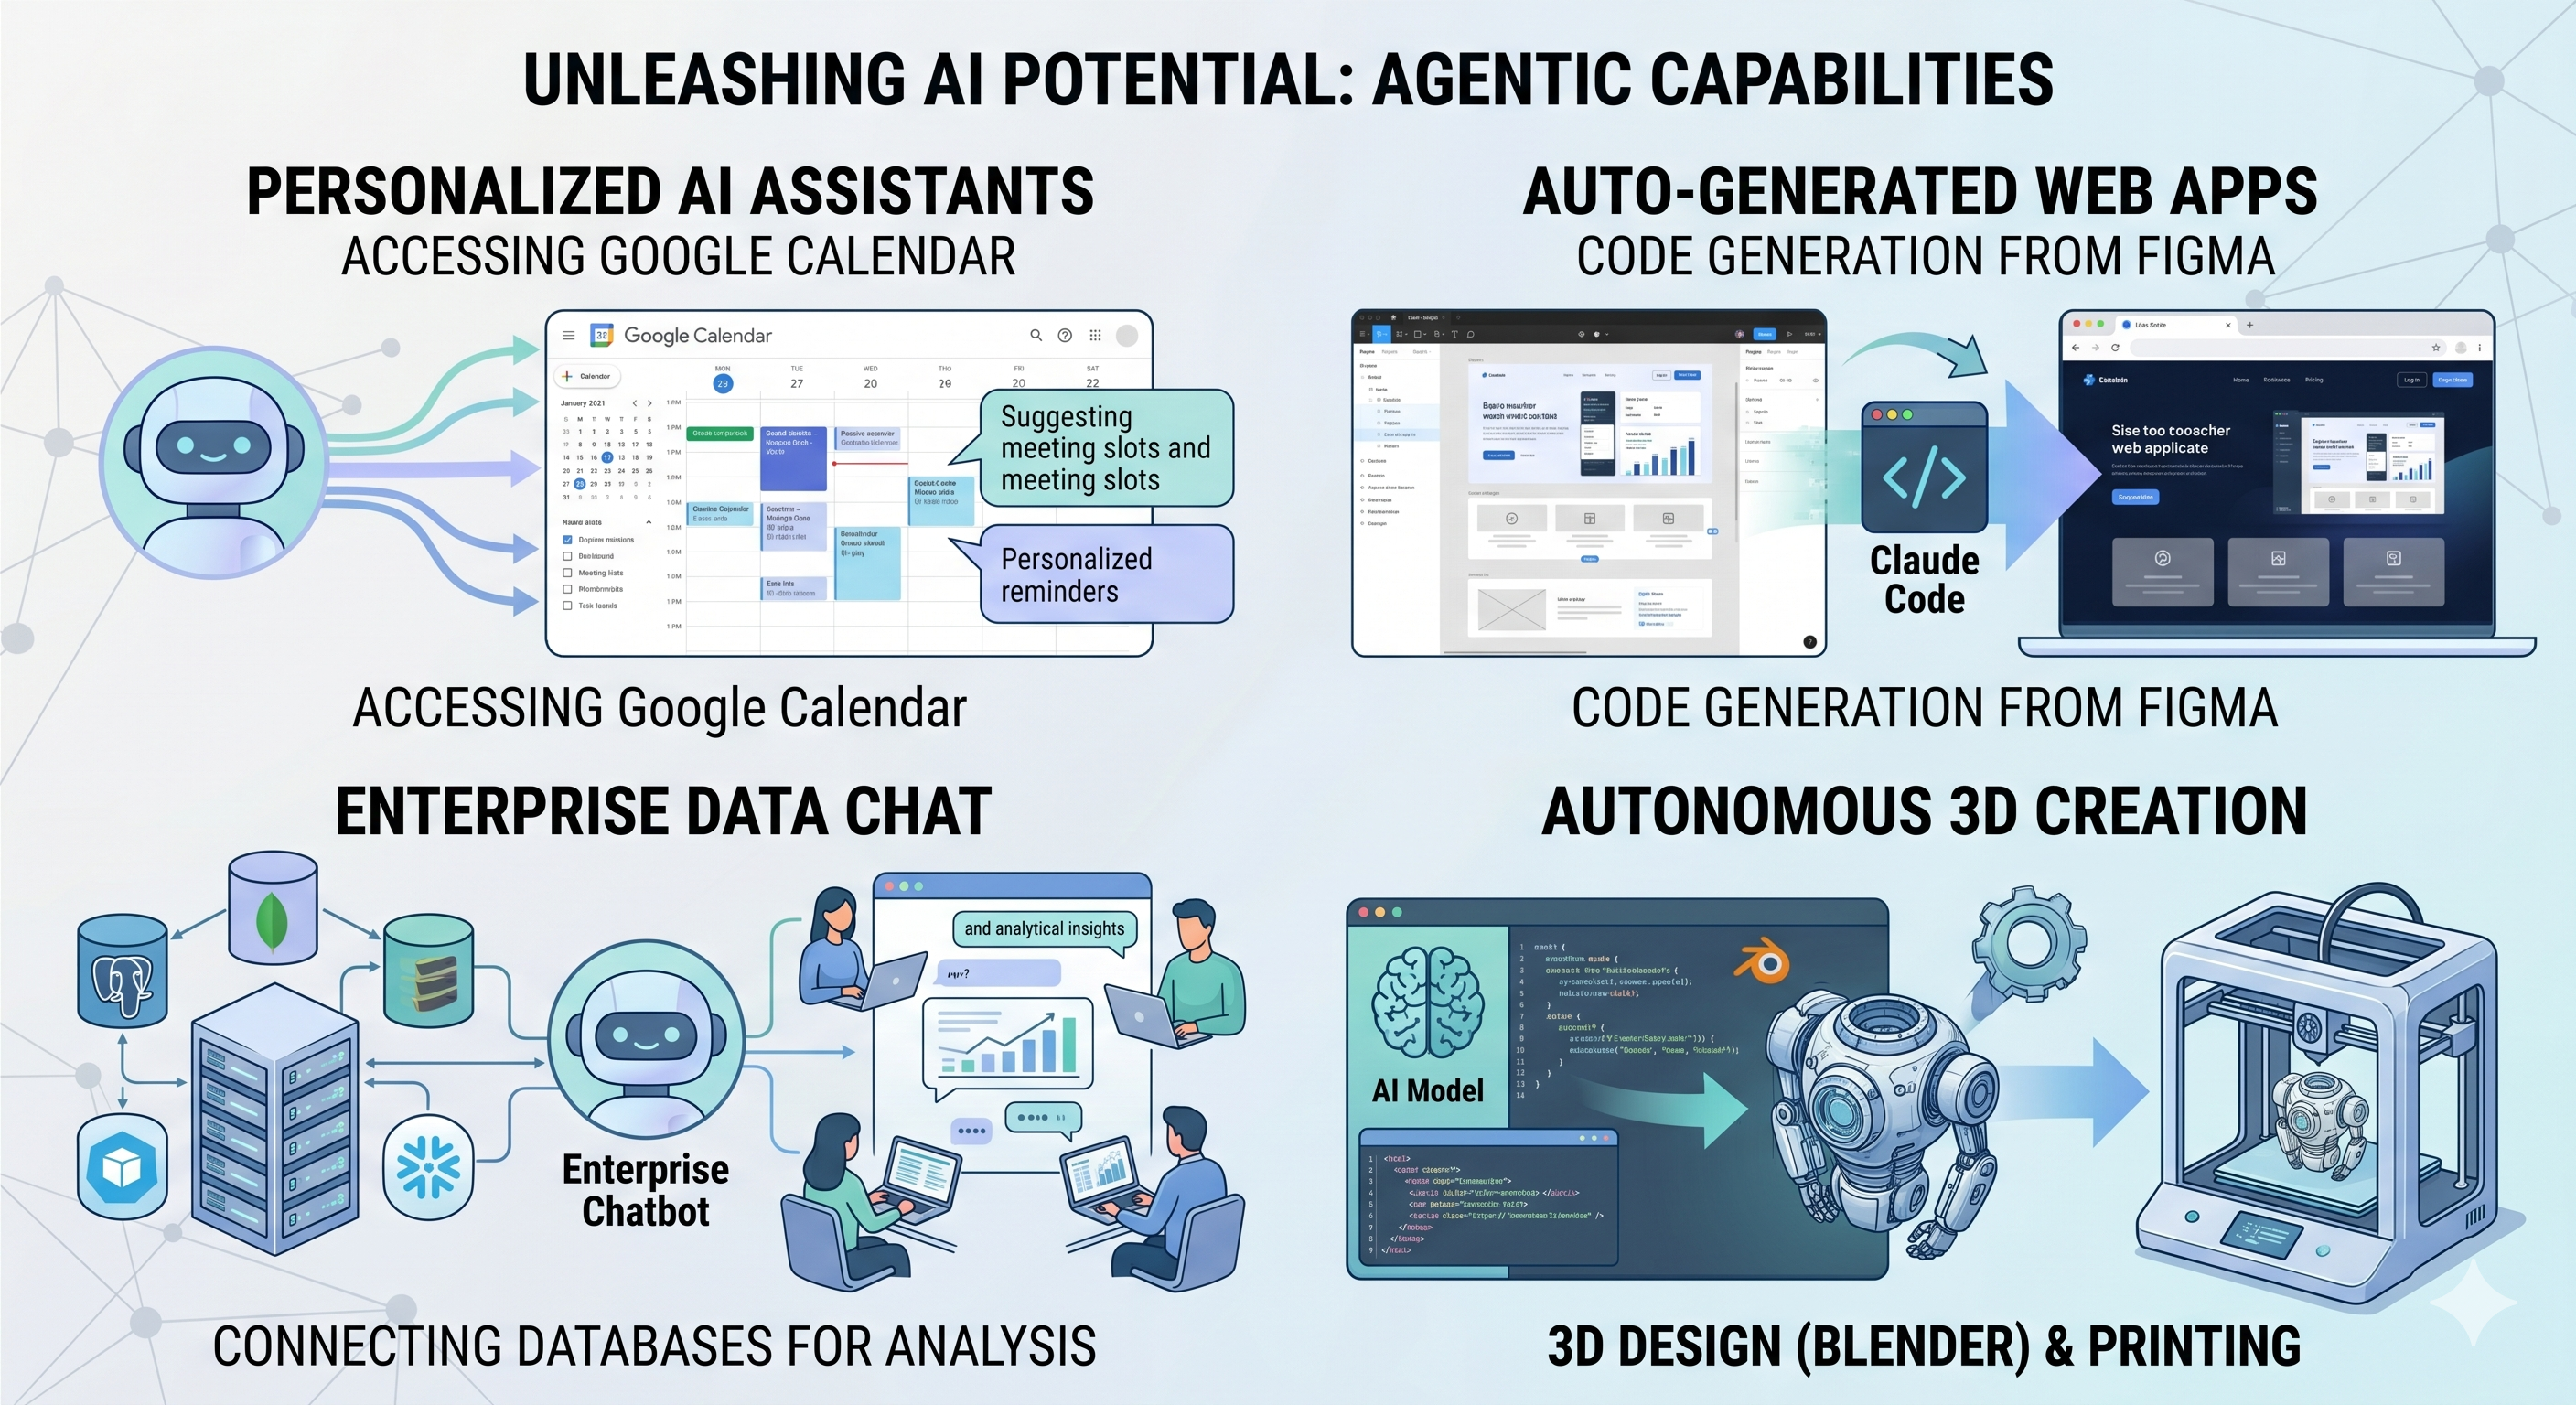
MCP (Model Context Protocol) is an open-source standard for connecting AI applications to external systems.Using MCP, AI applications like Claude or ChatGPT can connect to data sources (e.g. local files, databases), tools (e.g. search engines, calculators) and workflows (e.g. specialized prompts)—enabling them to access key information and perform tasks.Think of MCP like a USB-C port for AI applications. Just as USB-C provides a standardized way to connect electronic devices, MCP provides a standardized way to connect AI applications to external systems.
Agents can access your Google Calendar, acting as a more personalized AI assistant.
Claude Code can generate an entire web app using a Figma design.
Enterprise chatbots can connect to multiple databases across an organization, empowering users to analyze data using chat.
AI models can create 3D designs on Blender and print them out using a 3D printer.
Why MCP Matters to the Modern Platform Manager
As a Platform Manager, you’re already managing complexity. MCP isn’t just another library; it’s an open standard that allows your local IDE or AI assistant (like Claude) to “plug in” to your specific internal tools.
Instead of copying and pasting logs into a chatbot or manually checking API statuses, you build an MCP server that grants your AI the “eyes” and “hands” to interact with your services directly—with your explicit, human-in-the-loop approval.
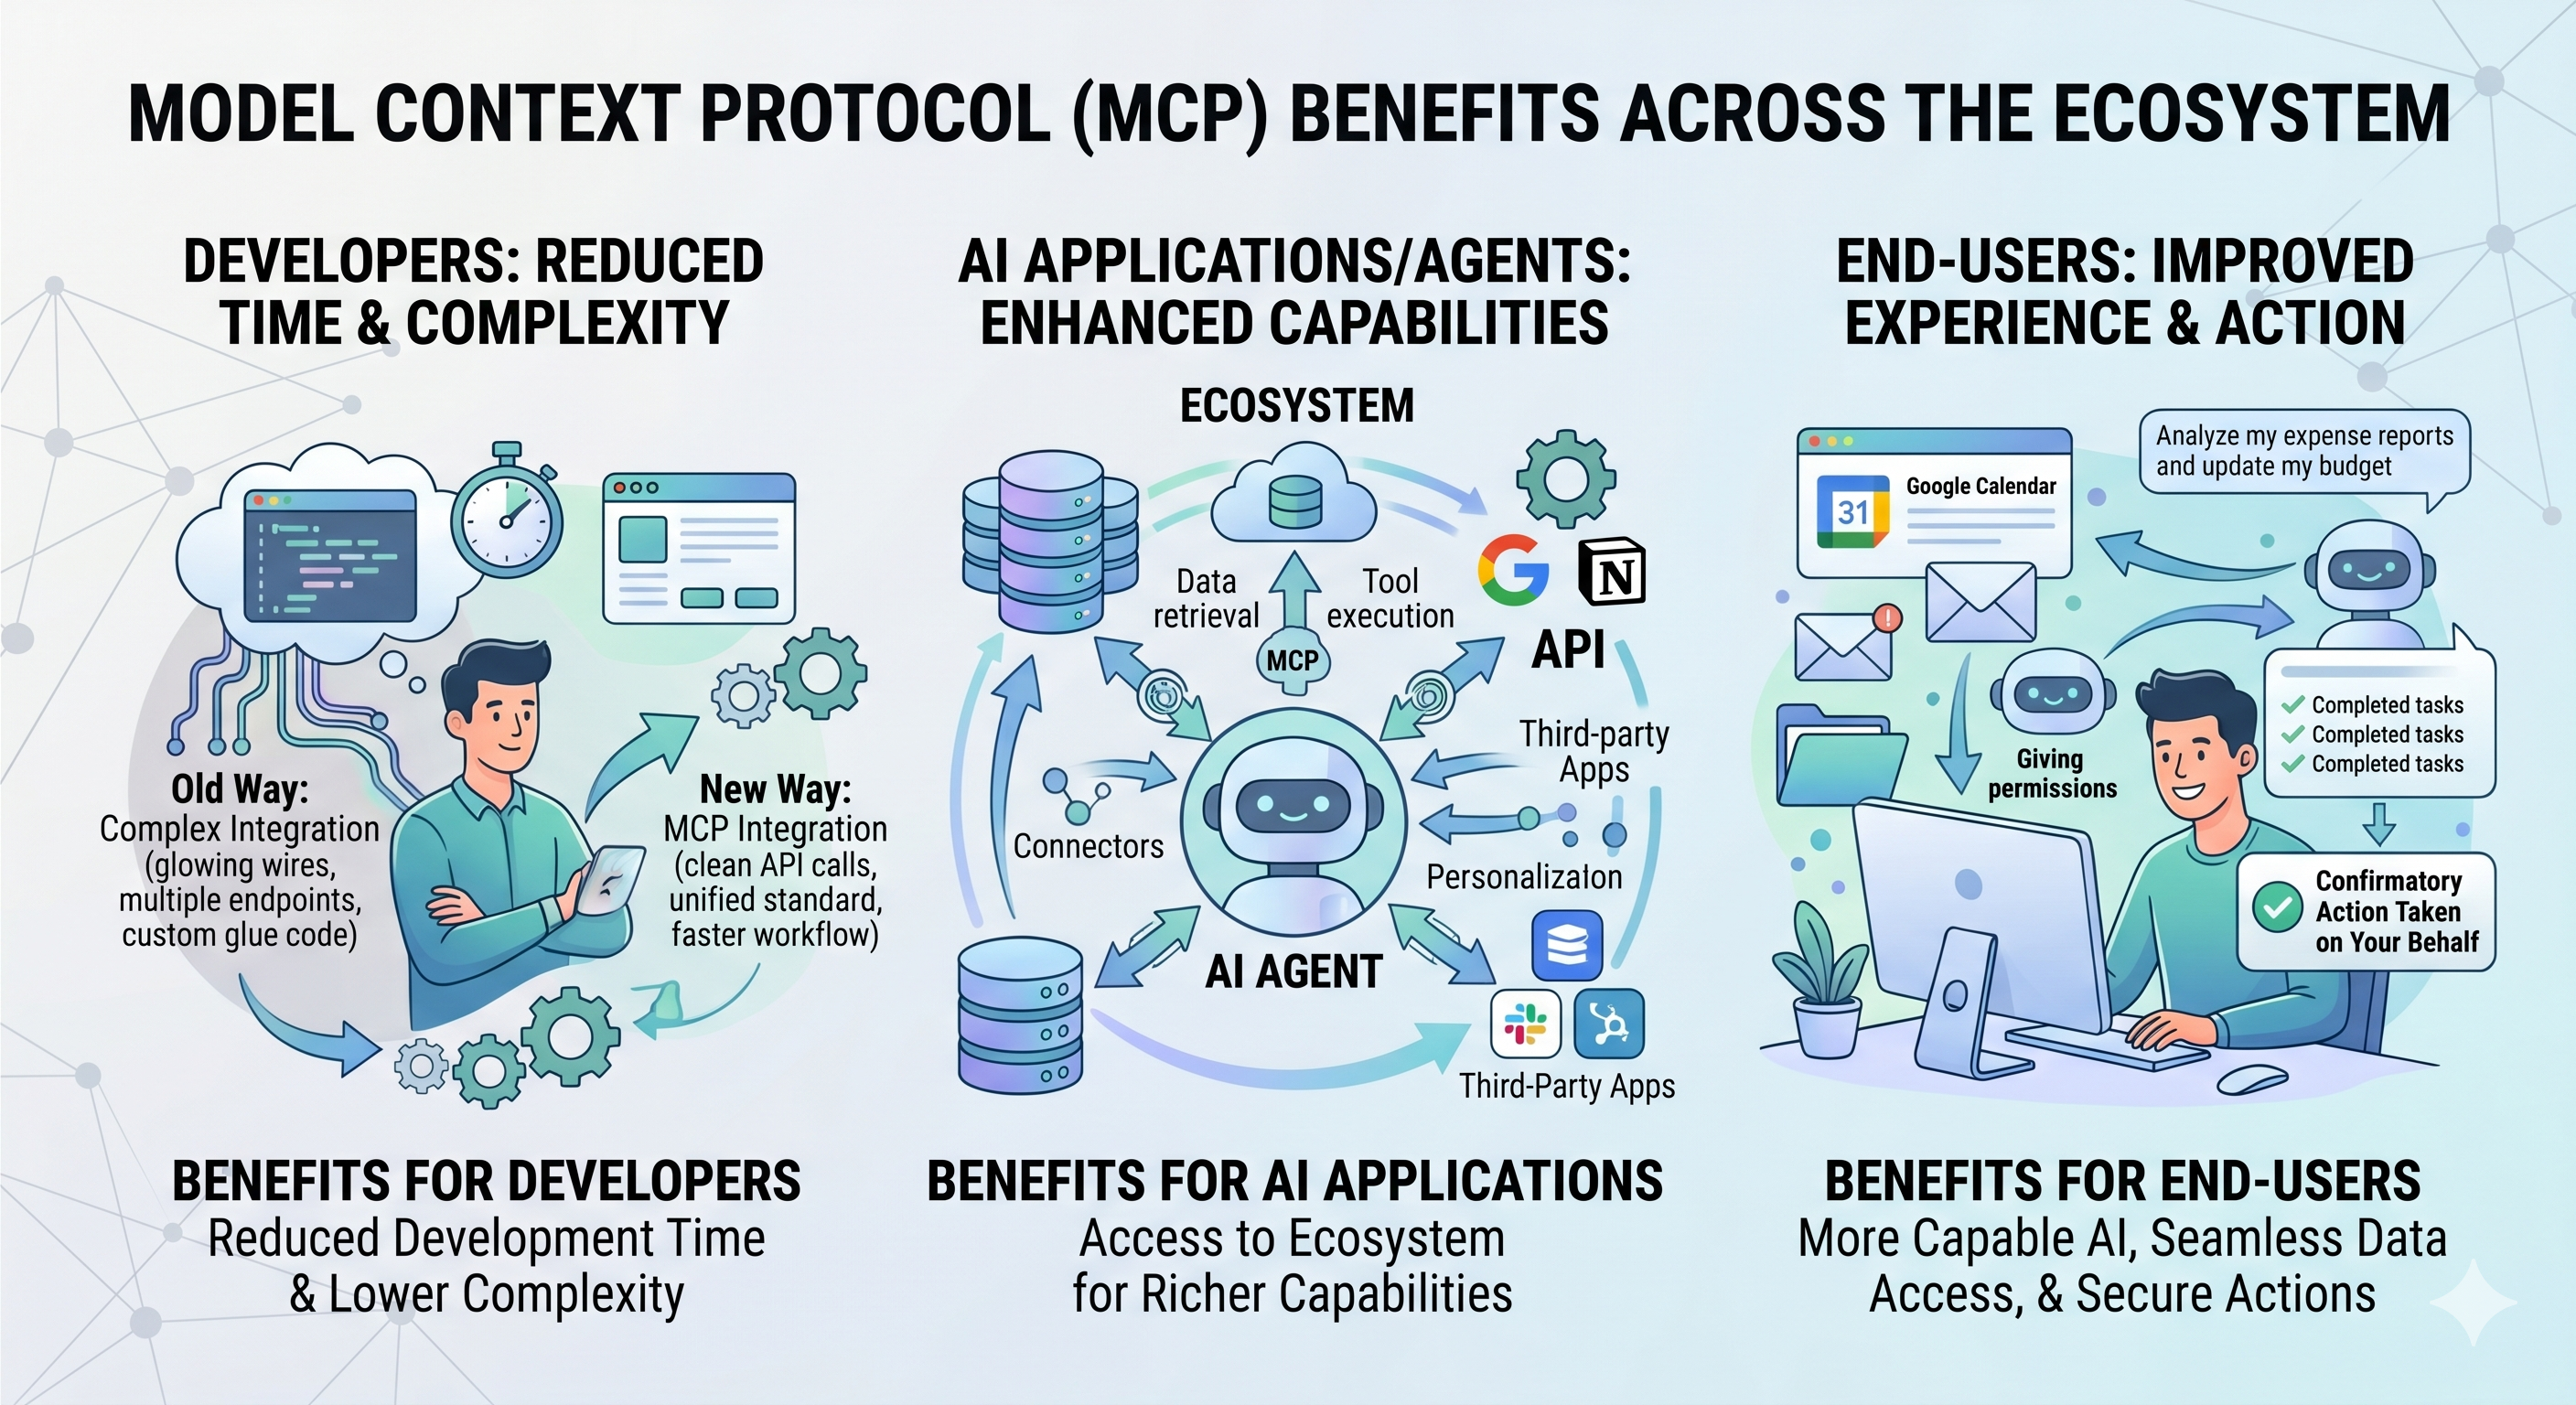
Developers: MCP reduces development time and complexity when building, or integrating with, an AI application or agent.
AI applications or agents: MCP provides access to an ecosystem of data sources, tools and apps which will enhance capabilities and improve the end-user experience.
End-users: MCP results in more capable AI applications or agents which can access your data and take actions on your behalf when necessary.
Building Your First MCP Server: A Practical Approach
To see how this fits into your existing ecosystem, let’s look at a simple implementation. We’ll build a Weather MCP Server. While simple, it mirrors the same pattern you would use to build a “Production Status” or “Cluster Inventory” server that your team could use to query infrastructure health in natural language.
1. The Architecture
MCP servers communicate via JSON-RPC, usually over standard I/O (stdio). This is the “connector” that allows the AI client to execute code defined in your server.
2. The Code (Pythonic Simplicity)
Using the FastMCP library, the boilerplate is minimal. You focus on the business logic—defining Tools that the AI can trigger.
"""Get the weather forecast for a specific coordinate."""
# Logic to interface with NWS API
...
The magic here is in the docstrings and type hints. The MCP SDK automatically introspects your code, telling the AI exactly what arguments are required (e.g., latitude, longitude), which significantly reduces hallucination and schema errors.
3. Connecting to the “Host”
In a DevOps context, the “Host” is the client—like Claude for Desktop, or perhaps a custom CLI tool your team uses. You register the server by updating a configuration file (like claude_desktop_config.json):
{
"mcpServers": {
"weather": {
"command": "uv",
"args": ["run", "/path/to/weather.py"]
}
}
}
The “DevOps” Mindset Applied to MCP
If you want to take this to the next level, stop thinking about weather data and start thinking about your Platform Interface:
Observability via MCP: Create a tool that queries your Prometheus/Grafana instances. Ask your AI: “What are the current error rates for the checkout service in prod?”
GitOps via MCP: Create a tool that wraps the argocd CLI. Ask your AI: “What is the current sync status of our core microservices in the Sydney region?”
Infrastructure Auditing: Create a tool that uses boto3 or Azure SDKs to audit security group rules. Ask: “Find any S3 buckets in the dev environment that are currently public.”
Final Thoughts: The New Infrastructure
We’ve spent decades optimizing the delivery of software. Now, the bottleneck is the interaction with the systems we’ve built. MCP is the bridge. It turns your documentation and APIs into living, conversational interfaces.
For those of us who have lived through the rise of Coding manually, Kubernetes and the transition to GitOps, this feels like the logical next step: making our internal platforms as discoverable and usable as the software we build on top of them.
Ready to start? Check out the official MCP Quickstart Guide to get your environment set up.
So, you’re doing the “right thing.” You’re preparing your AKS cluster for the future by enabling the OIDC Issuer and Workload Identity. You haven’t even migrated your apps to use Federated Identity yet—you’re still rocking the classic Azure Pod Identity (or just standard Service Accounts). No harm, no foul, right?
Wrong.
As soon as you flip the switch on OIDC, Kubernetes changes the fundamental way it treats Service Account tokens. If you have long-running batch jobs (like Airflow workers, Spark jobs, or long-polling sensors), you might be walking into a 401 Unauthorized trap.
The “Gotcha”: Token Lifespan
Before OIDC enablement, your pods likely used legacy tokens. These were static, long-lived (often valid for ~1 year), and lived as simple secrets. They were the “set it and forget it” of the auth world.
How do you know if you are using the OIDC tokens? Inspect the token in your containers /var/run/secrets/kubernetes.io/serviceaccount/token
If the Audience has xyz.oic.<env>-aks.azure.com, then its the OIDC token. Even though you have not implemented workload identity yet.
The Moment You Enable OIDC/Workload Identity: AKS shifts to Bound Projected Tokens. These are significantly more secure but come with a strict catch: The default expiration is 1 hour (3600 seconds).
If your app starts a session and doesn’t explicitly refresh that token, it will expire 60 minutes later. For a 4-hour batch job or a persistent sensor, this means your app will work perfectly… until it suddenly doesn’t.
Why It’s Sneaky
Azure Identity Still Works: Your connection to Key Vault or Storage via Pod Identity stays up.
The K8s API Fails: Only the calls within the cluster (like checking the status of another pod or a SparkApplication CRD) start throwing 401s.
It’s a Time Bomb: Everything looks fine in your 10-minute dev test. The failure only triggers in Production when the job hits the 61st minute or the token expired mid process.
The Quick Fix: The 24-Hour Band-Aid
If you aren’t ready to refactor your code to handle token rotation (which is the “real” fix), you can manually override the token lifespan using a Projected Volume in your Deployment or StatefulSet.
By mounting a custom token, you can extend that 1-hour window to something more batch-friendly, like 24 hours.
The Workaround YAML
You need to disable the automatic token mount and provide your own via volumes and volumeMounts.
While the 24-hour token buys you time, it’s a temporary safety net. Microsoft and the Kubernetes community are pushing for shorter token lifespans (AKS 1.33+ will likely enforce this more strictly).
Your to-do list:
Upgrade your SDKs: Modern Kubernetes clients (and Airflow providers) have built-in logic to reload tokens from the disk when they change.
Avoid Persistent Clients: Instead of one long-lived client object, initialize the client inside your retry loops.
Go All In: Finish the migration to Azure Workload Identity and move away from Pod Identity entirely.
Don’t let a security “improvement” become your next P1 incident. Check your batch job durations today!
TL;DR: In late Aug–Sep 2025, Bitnami (Broadcom) shifted most free images off docker.io/bitnami, introduced a latest-only, dev-intended “bitnamisecure” subset, archived versioned tags to docker.io/bitnamilegacy (no updates), ran rolling brownouts of popular images, and said their OCI Helm charts on Docker Hub would stop receiving updates (except for the tiny free subset). Result: lots of teams saw pull failures and surprise drift, especially for core bits like kubectl, ExternalDNS, PostgreSQL; some Helm charts still referenced images that went missing mid-migration. GitHub+2hub.docker.com+2
What changed (and when)
Timeline. Bitnami announced the change for 28 Aug 2025, then postponed deletion of the public catalog to 29 Sep 2025, running three 24-hour brownouts to “raise awareness.” Brownout sets explicitly included external-dns (Aug 28) and kubectl, redis, postgresql, mongodb (Sep 17). Tags were later restored, except very old distro bases. GitHub
Free tier becomes “bitnamisecure/…” Available only as latest and “intended for development” (their wording). No version matrix. hub.docker.com+1
Legacy archive. Versioned tags moved to docker.io/bitnamilegacy—no updates, no support; meant only as a temporary bridge. GitHub+1
Charts. Source code stays on GitHub, but OCI charts on Docker Hub stop receiving updates (except the small free subset) and won’t work out-of-the-box unless you override image repos. Bitnami’s own FAQ shows helm upgrade … --set image.repository=bitnamilegacy/... as a short-term band-aid. GitHub
That mix of latest-only + brownouts + chart defaults still pointing at moved/blocked images is why so many clusters copped it, bru—especially anything depending on kubectl sidecars/hooks, ExternalDNS, or PostgreSQL images. GitHub
Why “latest-only, dev-intended” breaks production hygiene
Production needs immutability and pinning. “Latest” is mutable and can introduce breaking changes or CVE regressions without your staging gates ever seeing them. Bitnami explicitly positions these bitnamisecure/* freebies as development-only; if you need versions, you’re pointed to a paid catalog. That alone makes the free images not fit for prod, regardless of hardening claims. hub.docker.com
How clusters actually broke
Brownouts removed popular images for 24h windows. If your charts/Jobs still pulled from docker.io/bitnami, pods simply couldn’t pull. Next reconciliation loop? CrashLoop/back-off. GitHub
Chart/image mismatch. OCI charts remain published but aren’t updated to point at the new repos; unless you override every image.repository (and sometimes initContainer/metrics sidecars), you deploy a chart that references unavailable images. Bitnami’s own example shows how many fields you might need to override in something like PostgreSQL. GitHub
kubectl images. Lots of ops charts use a tiny kubectl image for hooks or jobs. When bitnami/kubectl went dark during brownouts, those jobs failed. Upstream alternatives exist (see below). hub.docker.com+1
Better defaults for core components (ditch the vendor lock)
Wherever possible, move back upstream for the chart and use official/community images:
Velero – Upstream chart (VMware Tanzu Helm repo on Artifact Hub) and upstream images (pin). artifacthub.io
kubectl – Prefer upstream registry: registry.k8s.io hosts Kubernetes container images; several maintained images provide kubectl (or use distro images like alpine/kubectl/rancher/kubectl if they meet your standards—pin exact versions). GitHub+3Kubernetes+3GitHub+3
For stateful services:
PostgreSQL – Operators such as CloudNativePG (CNCF project). Alternatives include commercial operators; or, if you stick with straight images, use the official postgres image and manage via your own Helm/Kustomize. cloudnative-pg.io+1
MongoDB – Percona Operator for MongoDB (open-source) is a strong, widely used option. Percona Documentation+1
Redis – Consider the official redis image (or valkey where appropriate), plus a community operator if you need HA/cluster features; evaluate operator maturity and open issues for your SLA needs. (Context from Bitnami’s lists shows Redis/Valkey were part of the brownout sets.)
Questions Bitnami should answer publicly
Why ship a dev-only latest-only free tier for components that underpin production clusters, without a long freeze window and frictionless migration for chart defaults? (Their Docker Hub pages literally say latest-only and dev-intended.) hub.docker.com
Why brownouts of ubiquitous infra images (external-dns, kubectl, postgresql) during the migration window, increasing blast radius for unsuspecting teams? GitHub
Why leave OCI charts published but not updated to sane defaults (or at least yanking them) so new installs don’t reference unavailable registries by default?
Bitnami
Gain confidence, control and visibility of your software supply chain security with production-ready open source software delivered continuously in hardened images, with minimal CVEs and transparency you can trust.
We have lost confidence in your software supply chain.
TL;DR: Pin versions, set sane resources, respect system-node taints, make Gatekeeper happy, no-encoding secrets, and mirror images (Never pull from public registries and blindly trust them).
Works great on AKS, EKS, GKE — examples below use AKS.
The default dynakube template that Dynatrace provides you – will probably not work in the real world. You have zero trust, Calico firewalls, OPA Gatekeeper and perhaps some system pool taints?
Quick checks (healthy install):
dynatrace-operator Deployment is Ready
2x dynatrace-webhook pods
dynatrace-oneagent-csi-driver DaemonSet on every node (incl. system)
OneAgent pods per node (incl. system)
1x ActiveGate StatefulSet ready
Optional OTEL collector running if you enabled it
k get dynakube
NAME                  APIURL                                  STATUS    AGE
xxx-prd-xxxxxxxx      https://xxx.live.dynatrace.com/api   Running   13d
kubectl -n dynatrace get deploy,sts

# CSI & OneAgent on all nodes
kubectl -n dynatrace get ds

# Dynakube CR status
kubectl -n dynatrace get dynakube -o wide

# RBAC sanity for k8s monitoring
kubectl auth can-i list dynakubes.dynatrace.com \
  --as=system:serviceaccount:dynatrace:dynatrace-kubernetes-monitoring --all-namespaces

NAME                                 READY   UP-TO-DATE   AVAILABLE   AGE
deployment.apps/dynatrace-operator   1/1     1            1           232d
deployment.apps/dynatrace-webhook    2/2     2            2           13d

NAME                                                  READY   AGE
statefulset.apps/xxx-prd-xxxxxxxxxxx-activegate       1/1     13d
statefulset.apps/xxx-prd-xxxxxxxxxxx-otel-collector   1/1     13d
NAME                            DESIRED   CURRENT   READY   UP-TO-DATE   AVAILABLE   NODE SELECTOR   AGE
xxx-prd-xxxxxxxxxxx-oneagent    9         9         9       9            9           <none>          13d
dynatrace-oneagent-csi-driver   9         9         9       9            9           <none>          13d
NAME                  APIURL                                  STATUS    AGE
xxx-prd-xxxxxxxxxxx   https://xxx.live.dynatrace.com/api   Running   13d
yes
Here are field-tested tips to keep Dynatrace humming on Kubernetes without fighting OPA Gatekeeper, seccomp, or AKS quirks.
1) Start with a clean Dynakube spec (and pin your versions)
Pin your operator chart/image and treat upgrades as real change (PRs, changelog, Argo sync-waves). A lean cloudNativeFullStack baseline that plays nicely with Gatekeeper:
Why this works: it respects control-plane taints, adds the CriticalAddonsOnly toleration for system pools, sets reasonable resource bounds, and preps you for GitOps.
2) System node pools are sacred — add the toleration
If your CSI Driver or OneAgent skips system nodes, your visibility and injection can be patchy. Make sure you’ve got:
Your taints might be different, so check what taints you have on your systempools. This is the difference between “almost there” and “golden”.
3) Resource requests that won’t sandbag the cluster
OneAgent: requests: cpu 100m / mem 512Mi and limits: cpu 300m / mem 1.5Gi are a good starting point for mixed workloads.
ActiveGate: requests: 500m / 1.5Gi, limits: 1000m / 1.5Gi. Tune off SLOs and node shapes; don’t be shy to profile and trim.
4) Make Gatekeeper your mate (OPA policies that help, not hinder)
Enforce the seccomp hint on DynaKube CRs (so the operator sets profiles on init containers and your PSA/Gatekeeper policies stay green).
ConstraintTemplate (checks DynaKube annotations):
5) Secrets: avoid the dreaded encode (akv2k8s tip)
Kubernetes Secret.data is base64 on the wire, but tools like akv2k8s can also feed you values that are already base64. If using tools like akv2k8s, use this to transform the output.
This will ensure Dynatrace can read the Kubernentes Opaque secret as it, no base64 encoding on the secret.
6) Mirror images to your registry (and pin)
Air-gapping or just speeding up pulls? Mirror dynatrace-operator, activegate, dynatrace-otel-collector into your ACR/ECR/GCR and reference them via the Dynakube templates.*.imageRef blocks or Helm values. GitOps + private registry = fewer surprises.
We use ACR Cache.
7) RBAC: fix the “list dynakubes permission is missing” warning
If you see that warning in the UI, verify the service account:
kubectl auth can-i list dynakubes.dynatrace.com \ –as=system:serviceaccount:dynatrace:dynatrace-kubernetes-monitoring –all-namespaces
If “no”, ensure the chart installed/updated the ClusterRoleandClusterRoleBinding that grant list/watch/get on dynakubes.dynatrace.com. Sometimes upgrading the operator or re-syncing RBAC via Helm/Argo cleans it up.
When you install the Dynatrace Operator, you’ll see pods named something like dynatrace-webhook-xxxxx. They back one or more admission webhook configurations. In practice they do three big jobs:
Mutating Pods for OneAgent injection
Adds init containers / volume mounts / env vars so your app Pods load the OneAgent bits that come from the CSI driver.
Ensures the right binaries and libraries are available (e.g., via mounted volumes) and the process gets the proper preload/agent settings.
Respects opt-in/opt-out annotations/labels on namespaces and Pods (e.g. dynatrace.com/inject: "false" to skip a Pod).
Can also add Dynatrace metadata enrichment env/labels so the platform sees k8s context (workload, namespace, node, etc.).
Validating Dynatrace CRs (like DynaKube)
Schema and consistency checks: catches bad combinations (e.g., missing fields, wrong mode), so you don’t admit a broken config.
Helps avoid partial/failed rollouts by rejecting misconfigured specs early.
Hardening/compatibility tweaks
With certain features enabled, the mutating webhook helps ensure injected init containers comply with cluster policies (e.g., seccomp, PSA/PSS).
That’s why we recommend the annotation you’ve been using: feature.dynatrace.com/init-container-seccomp-profile: "true" It keeps Gatekeeper/PSA happy when it inspects the injected bits.
Why two dynatrace-webhook pods?
High availability for admission traffic. If one goes down, the other still serves the API server’s webhook calls.
How this ties into Gatekeeper/PSA
Gatekeeper (OPA) also uses validating admission.
The Dynatrace mutating webhook will first shape the Pod (add mounts/env/init).
Gatekeeper then validates the final Pod spec.
If you’re enforcing “must have seccomp/resources,” ensure Dynatrace’s injected init/sidecar also satisfies those rules (hence that seccomp annotation and resource limits you’ve set).
Dynatrace Active Gate
A Dynatrace ActiveGate acts as a secure proxy between Dynatrace OneAgents and Dynatrace Clusters or between Dynatrace OneAgents and other ActiveGates—those closer to the Dynatrace Cluster. It establishes Dynatrace presence—in your local network. In this way it allows you to reduce your interaction with Dynatrace to one single point—available locally. Besides convenience, this solution optimizes traffic volume, reduces the complexity of the network and cost. It also ensures the security of sealed networks.
The docs on Active Gate and version compatibility with Dynakube are not yet mature. Ensure the following:
With Dynatrace Operator 1.7 the v1beta1 and v1beta2 API versions for the DynaKube custom resource were removed.
ActiveGates up to and including version 1.323 used to call the v1beta1 endpoint. Starting from ActiveGate 1.325, the DynaKube endpoint was changed to v1beta3 Ensure your ActiveGate is up to date with the latest version.
As part of our ongoing platform reliability work, we’ve introduced explicit CPU and memory requests/limits for all Dynatrace components running on AKS.
🧩 Why it matters
Previously, the OneAgent and ActiveGate pods relied on Kubernetes’ default scheduling behaviour. This meant:
No guaranteed CPU/memory allocation → possible throttling or eviction during cluster load spikes.
Risk of noisy-neighbour effects on shared nodes.
Unpredictable autoscaling signals and Dynatrace performance fluctuations.
Setting requests and limits gives the scheduler clear boundaries:
Requests = guaranteed resources for stable operation
Limits = hard ceiling to prevent runaway usage
Helps Dynatrace collect telemetry without starving app workloads
These values were tuned from observed averages across DEV, UAT and PROD clusters. They provide a safe baseline—enough headroom for spikes while keeping node utilisation predictable.


You must be logged in to post a comment.