When it comes to deploying enterprise environments in Azure, managing complexity effectively is crucial. The Microsoft Cloud Adoption Framework (CAF) for Azure advocates for using multiple state files to configure various landing zones—this helps to balance risk, manage lifecycles, and accommodate diverse team functions more effectively. The traditional challenges associated with managing multiple state files can be mitigated through what we call “code-less composition,” which is an innovative approach facilitated by Terraform.
What is Code-less Composition?
In the realm of Terraform, every state file potentially interacts with others. Traditionally, configuring these interactions required manual scripting, which could be error-prone and tedious. Code-less composition simplifies this by allowing state files’ outputs to be used as input variables for another landing zone without writing any lines of code.
This feature is particularly valuable in complex architectures where you need to manage dependencies and configurations across multiple landing zones automatically. Essentially, it allows for seamless and scalable infrastructure as code practices.
How Does It Work in Azure with Terraform?
Terraform facilitates this through a feature that reads the state file’s output from one landing zone and uses it as input for another. This process is implemented through a simple variable in the Terraform configuration, vastly simplifying the setup of complex configurations. Here’s a look at how you can utilize this in your Azure environment:
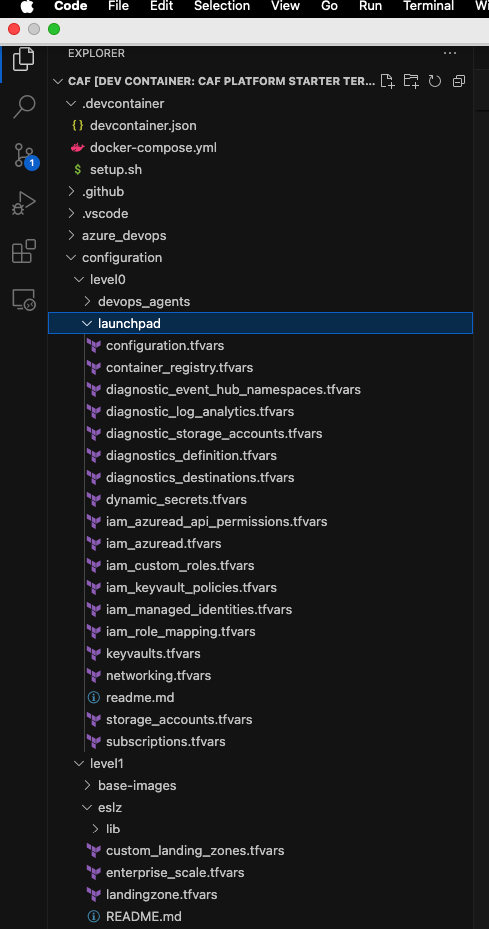
Example Configuration for a Management Landing Zone
Consider a management landing zone configured at level 1:
hclCopy codelandingzone = {
  backend_type        = "azurerm"
  level               = "level1"
  key                 = "management"
  global_settings_key = "launchpad"
  tfstates = {
    launchpad = {
      tfstate   = "caf_launchpad.tfstate"
      workspace = "tfstate"
      level     = "lower"
    }
  }
}
In this configuration, tfstates is an object where you specify the Terraform state file to load. For instance, the launchpad object loads the caf_launchpad.tfstate from a workspace (or storage container) called tfstate located one level lower. This setup indicates that any objects within this landing zone can refer to objects deployed in the same or a lower deployment level.
Referencing Resources Across Levels
For deploying resources that depend on configurations from another level, you can reference the necessary elements directly through your configurations:
hclCopy codeautomations = {
  account1 = {
    name = "automationAccount1"
    sku  = "Basic"
    resource_group = {
      key    = "auto-account"
      lz_key = "launchpad"
    }
  }
}
This snippet showcases how to deploy an automation account within a resource group provisioned in a lower level, demonstrating the composability of the framework.
Handling External Objects
When dealing with resources that are not deployed through Terraform or are managed outside of the Azure CAF object model, you can still reference these using their resource names or IDs:
Example with Resource Name
hclCopy codeautomations = {
  account1 = {
    name = "automationAccount1"
    sku  = "Basic"
    resource_group = {
      name    = "caf-auto-account-zooz-001"
    }
  }
}
Example with Resource ID
hclCopy codevirtual_hub_connections = {
  vnet_to_hub = {
    name = "vnet-connectivity-prod-fw-plinks-TO-vhub-prod"
    virtual_hub = {
      lz_key = "connectivity_virtual_hubs_prod"
      key    = "prod"
    }
    vnet = {
      resource_id = "/subscriptions/dklsdfk/etc."
    }
  }
}
Global Settings and Diagnostics
The hierarchy model of Azure CAF allows for global settings and diagnostics settings to be applied across all levels, ensuring consistent application of configurations like supported regions, naming conventions, and tag inheritance.
Conclusion
Code-less composition in Azure using Terraform represents a significant step forward in infrastructure automation. By reducing the need for manual coding, it not only minimizes human error but also speeds up the deployment process, allowing IT teams to focus more on strategic initiatives rather than getting bogged down by configuration complexities. This approach aligns with modern DevOps practices, offering a scalable, repeatable, and efficient method for managing cloud resources.


You must be logged in to post a comment.