Hey,
I sometimes get a crazy gas bill come through. So I decided to generate some raw data for my gas bill and feed it into the Azure Anomaly Detector API.
Prerequisites:
- An Azure subscription – Create one for free
- Python 3.x
- Pandas data analysis library
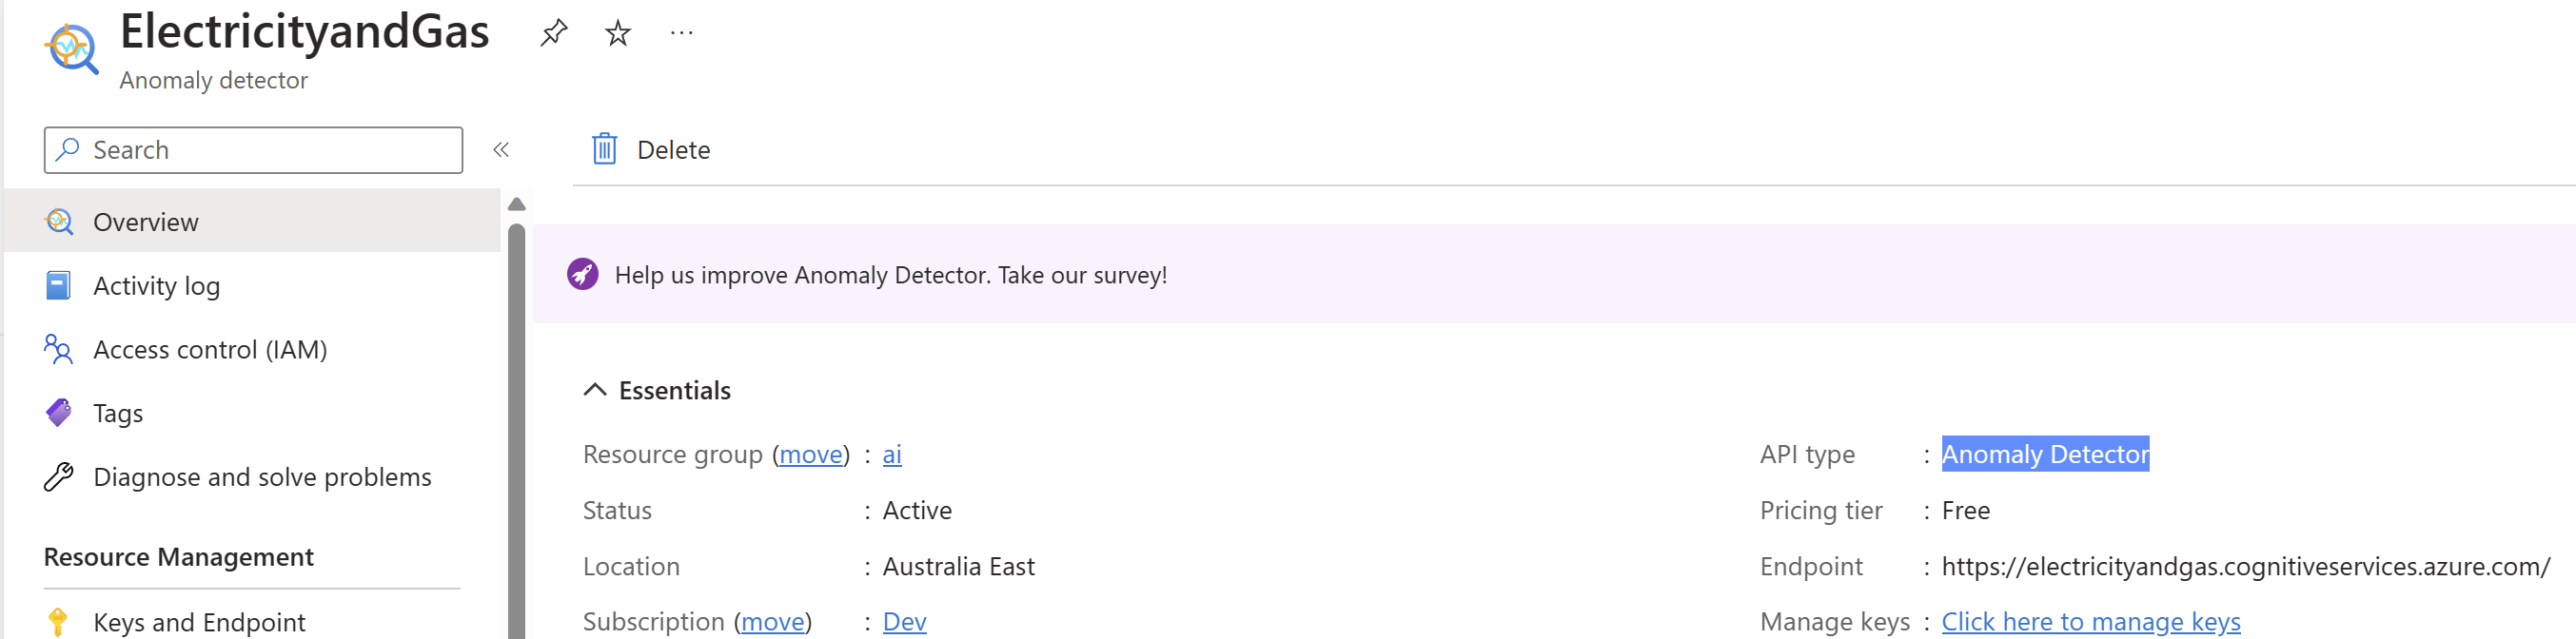
- Once you have your Azure subscription, create an Anomaly Detector resource in the Azure portal to get your key and endpoint. Wait for it to deploy and select the Go to resource button. You can use the free pricing tier (
F0) to try the service, and upgrade later to a paid tier for production.
With our new found Azure service up and running, lets get down and dirty.
Then I massaged by gas bill data into this format, so we have nice timestamps (ISO 8601) and double-precision floating-point numbers.
2021-08-01T00:00:00Z,46.49
2021-09-01T00:00:00Z,78.33
2021-10-01T00:00:00Z,80.39
2021-11-01T00:00:00Z,40.63
2021-12-01T00:00:00Z,154.76
2022-01-01T00:00:00Z,39.60
2022-02-01T00:00:00Z,37.19
2022-03-01T00:00:00Z,78.72
2022-04-01T00:00:00Z,20.98
2022-05-01T00:00:00Z,23.02
2022-06-01T00:00:00Z,107.82
2022-07-01T00:00:00Z,60.60
2022-08-01T00:00:00Z,54.96
2022-09-01T00:00:00Z,86.11
2022-10-01T00:00:00Z,81.61
2022-11-01T00:00:00Z,42.35
2022-12-01T00:00:00Z,55.36
2023-01-01T00:00:00Z,47.92
2023-02-01T00:00:00Z,48.05
2023-03-01T00:00:00Z,119.25
2023-04-01T00:00:00Z,61.10
2023-05-01T00:00:00Z,23.64
2023-06-01T00:00:00Z,151.32
2023-07-01T00:00:00Z,92.94
Finally, I created a jupyter notebook and fed the data into it, calling the api
from azure.ai.anomalydetector import AnomalyDetectorClient
from azure.ai.anomalydetector.models import *
from azure.core.credentials import AzureKeyCredential
import pandas as pd
import os

API_KEY = os.environ['ANOMALY_DETECTOR_API_KEY']
ENDPOINT = os.environ['ANOMALY_DETECTOR_ENDPOINT']
DATA_PATH = "d:\\ai\\energy-data.csv"

client = AnomalyDetectorClient(ENDPOINT, AzureKeyCredential(API_KEY))

series = []
data_file = pd.read_csv(DATA_PATH, header=None, encoding='utf-8', date_parser=[0])
for index, row in data_file.iterrows():
    series.append(TimeSeriesPoint(timestamp=row[0], value=row[1]))

request = UnivariateDetectionOptions(series=series, granularity=TimeGranularity.DAILY)

change_point_response = client.detect_univariate_change_point(request)
anomaly_response = client.detect_univariate_entire_series(request)

for i in range(len(data_file.values)):
    if (change_point_response.is_change_point[i]):
        print("Change point detected at index: "+ str(i))
    elif (anomaly_response.is_anomaly[i]):
        print("Anomaly detected at index:      "+ str(i))

It was great to see the AI system pickup the culprits!
- A massive party in December 2001
- A stove left on for a few days in June 2023 or maybe the gas company starting to charge us higher rates than they should?
Happy code with AI, it is super fun once you get creative with it!
🙂
- Uncategorized
