In the ever-evolving landscape of DevOps, continuous integration and continuous deployment (CI/CD) practices have become the backbone of modern software development. Two major players in this field are GitOps-based tools like ArgoCD and traditional CI/CD push architectures like Azure DevOps and GitHub Actions. Let’s embark on an exploratory journey to compare these two approaches, highlighting their unique features and determining which might be the best fit for your development workflow.
The Contenders
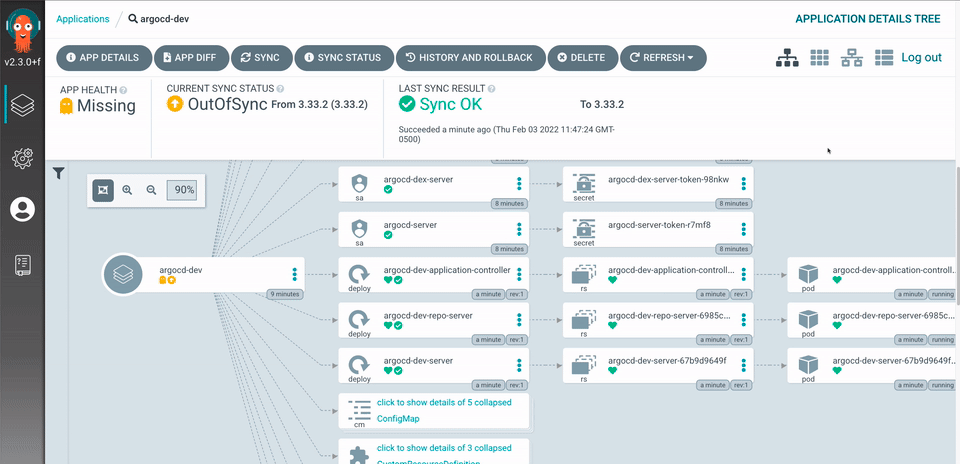
ArgoCD: A GitOps tool that utilizes a pull-based deployment model, designed for Kubernetes-centric environments. It focuses on maintaining the desired state of applications and infrastructure as defined in Git repositories.
Azure DevOps & GitHub Actions: Traditional CI/CD tools that utilize a push-based model. They are versatile, supporting various deployment environments beyond Kubernetes and integrating well with a wide range of development tools and services.
Round 1: Architecture and Approach
ArgoCD: The GitOps Champion

ArgoCD follows the GitOps paradigm, where the desired state of the system is stored in Git. This approach brings several advantages:
• Consistency: By maintaining the desired state configuration in Git, ArgoCD ensures that the actual state of the cluster matches the desired state, automatically correcting any drift.
• Security: Credentials and sensitive information remain within the Kubernetes cluster, reducing the risk of exposure.
• Versioning: Git’s inherent version control allows for easy rollbacks and audits, enhancing traceability and reliability.
ArgoCD shines in Kubernetes-centric environments where maintaining state consistency and security is paramount.
Azure DevOps & GitHub Actions: The Versatile Veterans

Azure DevOps and GitHub Actions adopt a more traditional push-based model, triggering deployments based on events (e.g., code commits). They offer:
• Flexibility: These tools support a wide range of deployment environments, from cloud-native applications to traditional on-premises systems.
• Simplicity: Familiarity among engineers and widespread documentation make them easier to adopt and implement.
• Structure: Compatibility with existing repository structures allows for seamless integration without significant restructuring.
These tools are ideal for diverse environments where flexibility and ease of use are critical.
Round 2: Deployment Models
Pull-Based Deployment (ArgoCD)
ArgoCD continuously monitors the Git repository for changes. When it detects a difference between the desired state in Git and the actual state in the cluster, it pulls the changes and applies them to the cluster.
Pros:
• Enhanced Security: By keeping sensitive information within the cluster.
• Automatic Sync: Ensures that the cluster state is always in sync with the Git repository.
Cons:
• Learning Curve: Requires a deeper understanding of Kubernetes and GitOps practices.
• Initial Setup: Can be more complex to set up compared to push-based models.
Push-Based Deployment (Azure DevOps & GitHub Actions)
In a push-based model, changes are pushed to the deployment environment when triggered by events such as code commits. The CI/CD pipeline executes and deploys the application.
Pros:
• Ease of Use: More intuitive for developers familiar with traditional CI/CD practices.
• Broad Support: Works well with various environments and tools.
Cons:
• Potential Inconsistencies: The actual state might drift from the desired state if not managed properly.
• Security Risks: Credentials might need to be managed outside the cluster.
Round 3: Integration and Ecosystem
ArgoCD
ArgoCD is tightly integrated with Kubernetes and excels in environments where Kubernetes is the primary platform. It integrates well with other cloud-native tools like Prometheus, Grafana, and various service meshes.
Azure DevOps & GitHub Actions
These tools boast a rich ecosystem with extensive integrations across various platforms and services, including cloud providers (Azure, AWS, GCP), container registries, and monitoring tools.
The Hybrid Approach: Best of Both Worlds
As highlighted in the recommendations from the Catalyst team, a hybrid approach leveraging both GitHub Actions for CI and ArgoCD for CD can offer the best of both worlds. This strategy allows teams to:
• Utilize GitHub Actions for building, testing, and initial deployment stages across diverse environments.
• Adopt ArgoCD for Kubernetes-specific deployments, ensuring state consistency and security.
Conclusion
The choice between ArgoCD and traditional CI/CD tools like Azure DevOps and GitHub Actions ultimately depends on your specific needs and environment. If your operations are Kubernetes-centric and you prioritize security and state consistency, ArgoCD is a robust choice. However, for diverse environments requiring flexibility and ease of use, Azure DevOps and GitHub Actions remain strong contenders.
By understanding the strengths and trade-offs of each approach, you can design a CI/CD pipeline that not only meets your operational requirements but also enhances the developer experience. Whether you choose ArgoCD, traditional push architectures, or a hybrid approach, the key is to align your tools with your development goals, ensuring efficient and reliable software delivery.
References
• CI/CD for AKS apps with GitHub Actions and GitFlow – Microsoft Learn
• DevOps Topologies – DevOps Topologies
By following this integrated approach, you can leverage the strengths of both GitHub Actions and ArgoCD, ensuring efficient and secure CI/CD processes tailored to your needs. This strategy promotes scalability, security, and developer productivity while accommodating the diverse requirements of modern software development.
Hope you enjoyed this detailed exploration of ArgoCD vs. traditional CI/CD push architectures. Keep experimenting, stay curious, and happy deploying!


You must be logged in to post a comment.