Tag: Prometheus

Kubernetes – Prometheus –  use an existing persistent volume claim

Kubernetes – Prometheus – use an existing persistent volume claim

We use the Prometheus Operator Chart to deploy the Prometheus, Alert Manager and Grafana stack,

Please note as of October 2020, the official Prometheus Operator Chart is.

prometheus-communityhttps://prometheus-community.github.io/helm-charts

To add this chart to your Helm repo.

helm repo add prometheus-community https://prometheus-community.github.io/helm-charts

What usually happens is that you will initially install the chart and by default your kubernetes PV will have a default policy of DELETE. This means if you uninstall the chart, the Persistent Volume in the cloud (Azure, AWS, GCP etc) will also be deleted. Not a great outcome if you want historic metrics.

What you want is a PV that has a reclaim policy of retain, so that when the chart is every uninstalled, your managed disks in the cloud are retained.

So how do you go about doing this?

  • Install the chart initially with a persistent volume configured in the values files for Prometheus. (The default way)
  • Configure Grafana correctly on the first install.

Stage 1

Prometheus

We using managed GKE/GCP, so standard storage class is fine, your cloud provider may be different.

  • Configure your Prometheus Operator chart with the following in the values file.
prometheus:    
    prometheusSpec:
      storageSpec:
        volumeClaimTemplate:
          spec:
            storageClassName: standard
            resources:
              requests:
                storage: 64Gi

Grafana

With Grafana, you can get away with setting it up correctly first time round.

Create the PVC

apiVersion: v1
kind: PersistentVolumeClaim
metadata:
  name: grafana
spec:
  accessModes:
    - ReadWriteOnce
  resources:
    requests:
      storage: 10Gi

Add the following to the Grafana values files.

grafana:
  persistence:
    enabled: true
    type: pvc
    existingClaim: pv-claim-grafana
  • Deploy your chart

Stage 2

Once the chart is deployed, go to your cloud provider and note the disk id’s. I am using GCP. So I note them down here:

In the above, the Name column is the disk id for GCP. Azure/AWS will be different e.g. Disk URI etc.

Go back to your helm chart repository and lets alter the chart so that Prometheus and Grafana are always bound to this disks, even if you uninstall the chart.

Prometheus

If you would like to keep the data of the current persistent volumes, it should be possible to attach existing volumes to new PVCs and PVs that are created using the conventions in the new chart. For example, in order to use an existing Azure disk for a helm release called `prometheus-operator` the following resources can be created:

  • Note down the RELEASE NAME of your prometheus operator chart. Mine is called prometheus operator.

Configure the following yaml template. This is a HACK. By making the name of the PV and PVC EXACTLY the same as the chart. Prometheus will reuse the PV/PVC.

apiVersion: v1
kind: PersistentVolume
metadata:
  name: pvc-prometheus-operator-prometheus-0
spec:
  storageClassName: "standard"
  capacity:
    storage: 64Gi
  accessModes:
    - ReadWriteOnce
  gcePersistentDisk:
    pdName: gke-dev-xyz-aae-pvc-d8971937-85f8-4566-b90e-110dfbc17cbb
    fsType: ext4
---
apiVersion: v1
kind: PersistentVolumeClaim
metadata:
  labels:
    app: prometheus
    prometheus: prometheus-operator-prometheus
  name:  prometheus-prometheus-operator-prometheus-db-prometheus-prometheus-operator-prometheus-0
spec:
  storageClassName: "standard"
  accessModes:
    - ReadWriteOnce
  resources:
    requests:
      storage: 64Gi
  • Configure the above to always run as a PreInstall hook e.g. with Helmfile
  - events: ["presync"]
    showlogs: true
    command: "kubectl"
    args:
    - apply
    - -n
    - monitoring
    - -f
    - ./pv/pv-prometheus.yaml

Grafana

Grafana is not so fussy. So we can do the following:

Configure the following yaml template.

apiVersion: v1
kind: PersistentVolume
metadata:
  name: pv-grafana
spec:
  storageClassName: "standard"
  capacity:
    storage: 10Gi
  accessModes:
    - ReadWriteOnce
  claimRef:
    namespace: service-compliance
    name: pv-claim-grafana
  gcePersistentDisk:
    pdName: gke-dev-xyz-aae-pvc-4b450590-8ec0-471d-bf1a-4f6aaa9c4e81
    fsType: ext4
---
apiVersion: v1
kind: PersistentVolumeClaim
metadata:
  name: pv-claim-grafana
spec:
  storageClassName: "standard"
  accessModes:
    - ReadWriteOnce
  resources:
    requests:
      storage: 10Gi

Then finally setup a preinstall helm sync if using helmfile

  hooks:
  - events: ["presync"]
    showlogs: true
    command: "kubectl"
    args:
    - apply
    - -n
    - monitoring
    - -f
    - ./pv/pv-grafana.yaml

With the above in place, you will be able to rerun chart installs for updates and uninstall the chart. Your final check is to ensure the PVs are RETAIN and not on the DELETE policy.

Advertisement
Site Reliability Engineering with Gitops & Kubernetes – Part 1

Site Reliability Engineering with Gitops & Kubernetes – Part 1

Intro

One of the key pillars regarding SRE is being able to make quantitative decisions based on key metrics.

The major challenge is what are key metrics and this is testament to the plethora of monitoring software out in the wild today.

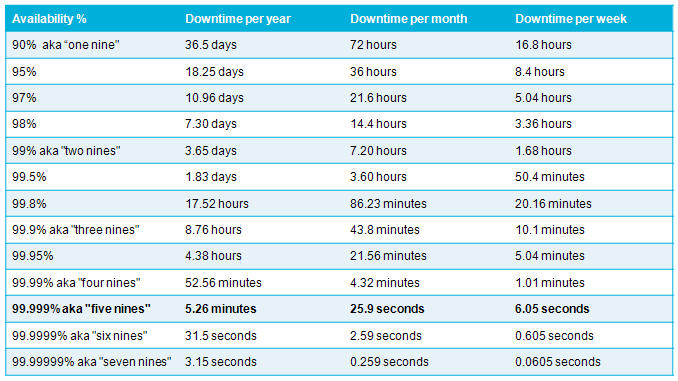
At a foundational level you want to ensure your services are always running, however 100% availability in not practical.

Class SRE implements Devops
{
  MeasureEverything()
}

Availability/Error Budget

You then figure out what availability is practical for your application and services.

Availability

Your error budget will then be the downtime figure e.g. 99% is 7.2 hours of downtime a month that you can afford to have.

SLAs, SLOs and SLIs

This will be the starting point on your journey to implementing quantitative analysis to

  • Service Level Agreements
  • Service Level Objectives
  • Service Level Indicators

This blog post is all about how you can measure Service Level Objectives without breaking the bank. You do not need to spend millions of dollars on bloated monitoring solutions to observe key metrics that really impact your customers.

Just like baking a cake, these are the ingredients we will use to implement an agile, scaleable monitoring platform that is solely dedicated to doing one thing well.

Outcome

This is what we want our cake to deliver:

  • Measuring your SLA Compliance Level
  • Measuring your Error Budget Burn Rate
  • Measuring if you have exhausted your error budget
Service Level Compliance – SLAs -> SLOs -> SLIs

If you look at the cake above, you can see all your meaningful information in one dashboard.

  1. Around 11am the error budget burn rate went up. (A kin to your kids spending all their pocket money in one day!)
  2. Compliance was breached (99% availability) – The purple line (burn rate) went above the maximum budget (yellow line)

These are metrics you will want to ALERT on at any time of the day. These sort of metrics matter. They are violating a Service Level Agreement.

What about my other metrics?

Aaaah, like %Disk Queue Length, Processor Time, Kubernetes Nodes/Pods/Pools etc? Well…

I treat these metrics as second class citizens. Like a layered onion. Your initial metrics should be – Am I violating my SLA? If not, then you can use the other metrics that we have enjoyed over the decades to compliment your observeability into the systems and as a visual aid for diagnostics and troubleshooting.

Alerting

Another important consideration is the evolution of infrastructure. In 1999 you will have wanted to receive an alert if a server ran out of disk space. In 2020, you are running container orchestration clusters and other high availability systems. A container running out of disk space is not so critical as it used to be in 1999.

  • Evaluate every single alert you have and ask yourself. Do I really need to wake someone up at 3am for this problem?
  • Always alert on Service Level Compliance levels ABOUT to breach
  • Always alert on Error Budget Burn Rates going up sharply
  • Do not alert someone out of hours because the CPU is 100% for 5 minutes unless Service Level Compliance is being affected to

You will have happier engineers and a more productive team. You will be cooled headed during an incident because you know the different between a cluster node going down versus Service Level Compliance violations. Always solve the Service Level Compliance and then fix the other problems.

Ingredients

Where are the ingredients you promised? You said it will not break the bank, I am intrigued.

Summary

In this post we have touched on the FOUNDATION of what we want out of monitoring.

We know exactly what we want to measure – Service Level Compliance, Error Budget Burn Rate and Max Budget. All this revolves around deciding on the level of availability we give a service.

We touched on the basic ingredients that we can use to build this solution.

In my next blog post we will discuss how we mix all these ingredients together to provide a platform that is is good at doing one thing well.

Measuring Service Level Compliance & Error Budget Burn Rates

When you give your child $30 to spend a month and they need to save $10 a month. You need to be alerted if they spending too fast (Burn Rate).