So, you’re doing the “right thing.” You’re preparing your AKS cluster for the future by enabling the OIDC Issuer and Workload Identity. You haven’t even migrated your apps to use Federated Identity yet—you’re still rocking the classic Azure Pod Identity (or just standard Service Accounts). No harm, no foul, right?
Wrong.
As soon as you flip the switch on OIDC, Kubernetes changes the fundamental way it treats Service Account tokens. If you have long-running batch jobs (like Airflow workers, Spark jobs, or long-polling sensors), you might be walking into a 401 Unauthorized trap.
The “Gotcha”: Token Lifespan
Before OIDC enablement, your pods likely used legacy tokens. These were static, long-lived (often valid for ~1 year), and lived as simple secrets. They were the “set it and forget it” of the auth world.
How do you know if you are using the OIDC tokens? Inspect the token in your containers /var/run/secrets/kubernetes.io/serviceaccount/token
If the Audience has xyz.oic.<env>-aks.azure.com, then its the OIDC token. Even though you have not implemented workload identity yet.
The Moment You Enable OIDC/Workload Identity: AKS shifts to Bound Projected Tokens. These are significantly more secure but come with a strict catch: The default expiration is 1 hour (3600 seconds).
If your app starts a session and doesn’t explicitly refresh that token, it will expire 60 minutes later. For a 4-hour batch job or a persistent sensor, this means your app will work perfectly… until it suddenly doesn’t.
Why It’s Sneaky
Azure Identity Still Works: Your connection to Key Vault or Storage via Pod Identity stays up.
The K8s API Fails: Only the calls within the cluster (like checking the status of another pod or a SparkApplication CRD) start throwing 401s.
It’s a Time Bomb: Everything looks fine in your 10-minute dev test. The failure only triggers in Production when the job hits the 61st minute or the token expired mid process.
The Quick Fix: The 24-Hour Band-Aid
If you aren’t ready to refactor your code to handle token rotation (which is the “real” fix), you can manually override the token lifespan using a Projected Volume in your Deployment or StatefulSet.
By mounting a custom token, you can extend that 1-hour window to something more batch-friendly, like 24 hours.
The Workaround YAML
You need to disable the automatic token mount and provide your own via volumes and volumeMounts.
While the 24-hour token buys you time, it’s a temporary safety net. Microsoft and the Kubernetes community are pushing for shorter token lifespans (AKS 1.33+ will likely enforce this more strictly).
Your to-do list:
Upgrade your SDKs: Modern Kubernetes clients (and Airflow providers) have built-in logic to reload tokens from the disk when they change.
Avoid Persistent Clients: Instead of one long-lived client object, initialize the client inside your retry loops.
Go All In: Finish the migration to Azure Workload Identity and move away from Pod Identity entirely.
Don’t let a security “improvement” become your next P1 incident. Check your batch job durations today!
TL;DR: In late Aug–Sep 2025, Bitnami (Broadcom) shifted most free images off docker.io/bitnami, introduced a latest-only, dev-intended “bitnamisecure” subset, archived versioned tags to docker.io/bitnamilegacy (no updates), ran rolling brownouts of popular images, and said their OCI Helm charts on Docker Hub would stop receiving updates (except for the tiny free subset). Result: lots of teams saw pull failures and surprise drift, especially for core bits like kubectl, ExternalDNS, PostgreSQL; some Helm charts still referenced images that went missing mid-migration. GitHub+2hub.docker.com+2
What changed (and when)
Timeline. Bitnami announced the change for 28 Aug 2025, then postponed deletion of the public catalog to 29 Sep 2025, running three 24-hour brownouts to “raise awareness.” Brownout sets explicitly included external-dns (Aug 28) and kubectl, redis, postgresql, mongodb (Sep 17). Tags were later restored, except very old distro bases. GitHub
Free tier becomes “bitnamisecure/…” Available only as latest and “intended for development” (their wording). No version matrix. hub.docker.com+1
Legacy archive. Versioned tags moved to docker.io/bitnamilegacy—no updates, no support; meant only as a temporary bridge. GitHub+1
Charts. Source code stays on GitHub, but OCI charts on Docker Hub stop receiving updates (except the small free subset) and won’t work out-of-the-box unless you override image repos. Bitnami’s own FAQ shows helm upgrade … --set image.repository=bitnamilegacy/... as a short-term band-aid. GitHub
That mix of latest-only + brownouts + chart defaults still pointing at moved/blocked images is why so many clusters copped it, bru—especially anything depending on kubectl sidecars/hooks, ExternalDNS, or PostgreSQL images. GitHub
Why “latest-only, dev-intended” breaks production hygiene
Production needs immutability and pinning. “Latest” is mutable and can introduce breaking changes or CVE regressions without your staging gates ever seeing them. Bitnami explicitly positions these bitnamisecure/* freebies as development-only; if you need versions, you’re pointed to a paid catalog. That alone makes the free images not fit for prod, regardless of hardening claims. hub.docker.com
How clusters actually broke
Brownouts removed popular images for 24h windows. If your charts/Jobs still pulled from docker.io/bitnami, pods simply couldn’t pull. Next reconciliation loop? CrashLoop/back-off. GitHub
Chart/image mismatch. OCI charts remain published but aren’t updated to point at the new repos; unless you override every image.repository (and sometimes initContainer/metrics sidecars), you deploy a chart that references unavailable images. Bitnami’s own example shows how many fields you might need to override in something like PostgreSQL. GitHub
kubectl images. Lots of ops charts use a tiny kubectl image for hooks or jobs. When bitnami/kubectl went dark during brownouts, those jobs failed. Upstream alternatives exist (see below). hub.docker.com+1
Better defaults for core components (ditch the vendor lock)
Wherever possible, move back upstream for the chart and use official/community images:
Velero – Upstream chart (VMware Tanzu Helm repo on Artifact Hub) and upstream images (pin). artifacthub.io
kubectl – Prefer upstream registry: registry.k8s.io hosts Kubernetes container images; several maintained images provide kubectl (or use distro images like alpine/kubectl/rancher/kubectl if they meet your standards—pin exact versions). GitHub+3Kubernetes+3GitHub+3
For stateful services:
PostgreSQL – Operators such as CloudNativePG (CNCF project). Alternatives include commercial operators; or, if you stick with straight images, use the official postgres image and manage via your own Helm/Kustomize. cloudnative-pg.io+1
MongoDB – Percona Operator for MongoDB (open-source) is a strong, widely used option. Percona Documentation+1
Redis – Consider the official redis image (or valkey where appropriate), plus a community operator if you need HA/cluster features; evaluate operator maturity and open issues for your SLA needs. (Context from Bitnami’s lists shows Redis/Valkey were part of the brownout sets.)
Questions Bitnami should answer publicly
Why ship a dev-only latest-only free tier for components that underpin production clusters, without a long freeze window and frictionless migration for chart defaults? (Their Docker Hub pages literally say latest-only and dev-intended.) hub.docker.com
Why brownouts of ubiquitous infra images (external-dns, kubectl, postgresql) during the migration window, increasing blast radius for unsuspecting teams? GitHub
Why leave OCI charts published but not updated to sane defaults (or at least yanking them) so new installs don’t reference unavailable registries by default?
Bitnami
Gain confidence, control and visibility of your software supply chain security with production-ready open source software delivered continuously in hardened images, with minimal CVEs and transparency you can trust.
We have lost confidence in your software supply chain.
TL;DR: Pin versions, set sane resources, respect system-node taints, make Gatekeeper happy, no-encoding secrets, and mirror images (Never pull from public registries and blindly trust them).
Works great on AKS, EKS, GKE — examples below use AKS.
The default dynakube template that Dynatrace provides you – will probably not work in the real world. You have zero trust, Calico firewalls, OPA Gatekeeper and perhaps some system pool taints?
Quick checks (healthy install):
dynatrace-operator Deployment is Ready
2x dynatrace-webhook pods
dynatrace-oneagent-csi-driver DaemonSet on every node (incl. system)
OneAgent pods per node (incl. system)
1x ActiveGate StatefulSet ready
Optional OTEL collector running if you enabled it
k get dynakube
NAME                  APIURL                                  STATUS    AGE
xxx-prd-xxxxxxxx      https://xxx.live.dynatrace.com/api   Running   13d
kubectl -n dynatrace get deploy,sts

# CSI & OneAgent on all nodes
kubectl -n dynatrace get ds

# Dynakube CR status
kubectl -n dynatrace get dynakube -o wide

# RBAC sanity for k8s monitoring
kubectl auth can-i list dynakubes.dynatrace.com \
  --as=system:serviceaccount:dynatrace:dynatrace-kubernetes-monitoring --all-namespaces

NAME                                 READY   UP-TO-DATE   AVAILABLE   AGE
deployment.apps/dynatrace-operator   1/1     1            1           232d
deployment.apps/dynatrace-webhook    2/2     2            2           13d

NAME                                                  READY   AGE
statefulset.apps/xxx-prd-xxxxxxxxxxx-activegate       1/1     13d
statefulset.apps/xxx-prd-xxxxxxxxxxx-otel-collector   1/1     13d
NAME                            DESIRED   CURRENT   READY   UP-TO-DATE   AVAILABLE   NODE SELECTOR   AGE
xxx-prd-xxxxxxxxxxx-oneagent    9         9         9       9            9           <none>          13d
dynatrace-oneagent-csi-driver   9         9         9       9            9           <none>          13d
NAME                  APIURL                                  STATUS    AGE
xxx-prd-xxxxxxxxxxx   https://xxx.live.dynatrace.com/api   Running   13d
yes
Here are field-tested tips to keep Dynatrace humming on Kubernetes without fighting OPA Gatekeeper, seccomp, or AKS quirks.
1) Start with a clean Dynakube spec (and pin your versions)
Pin your operator chart/image and treat upgrades as real change (PRs, changelog, Argo sync-waves). A lean cloudNativeFullStack baseline that plays nicely with Gatekeeper:
Why this works: it respects control-plane taints, adds the CriticalAddonsOnly toleration for system pools, sets reasonable resource bounds, and preps you for GitOps.
2) System node pools are sacred — add the toleration
If your CSI Driver or OneAgent skips system nodes, your visibility and injection can be patchy. Make sure you’ve got:
Your taints might be different, so check what taints you have on your systempools. This is the difference between “almost there” and “golden”.
3) Resource requests that won’t sandbag the cluster
OneAgent: requests: cpu 100m / mem 512Mi and limits: cpu 300m / mem 1.5Gi are a good starting point for mixed workloads.
ActiveGate: requests: 500m / 1.5Gi, limits: 1000m / 1.5Gi. Tune off SLOs and node shapes; don’t be shy to profile and trim.
4) Make Gatekeeper your mate (OPA policies that help, not hinder)
Enforce the seccomp hint on DynaKube CRs (so the operator sets profiles on init containers and your PSA/Gatekeeper policies stay green).
ConstraintTemplate (checks DynaKube annotations):
5) Secrets: avoid the dreaded encode (akv2k8s tip)
Kubernetes Secret.data is base64 on the wire, but tools like akv2k8s can also feed you values that are already base64. If using tools like akv2k8s, use this to transform the output.
This will ensure Dynatrace can read the Kubernentes Opaque secret as it, no base64 encoding on the secret.
6) Mirror images to your registry (and pin)
Air-gapping or just speeding up pulls? Mirror dynatrace-operator, activegate, dynatrace-otel-collector into your ACR/ECR/GCR and reference them via the Dynakube templates.*.imageRef blocks or Helm values. GitOps + private registry = fewer surprises.
We use ACR Cache.
7) RBAC: fix the “list dynakubes permission is missing” warning
If you see that warning in the UI, verify the service account:
kubectl auth can-i list dynakubes.dynatrace.com \ –as=system:serviceaccount:dynatrace:dynatrace-kubernetes-monitoring –all-namespaces
If “no”, ensure the chart installed/updated the ClusterRoleandClusterRoleBinding that grant list/watch/get on dynakubes.dynatrace.com. Sometimes upgrading the operator or re-syncing RBAC via Helm/Argo cleans it up.
When you install the Dynatrace Operator, you’ll see pods named something like dynatrace-webhook-xxxxx. They back one or more admission webhook configurations. In practice they do three big jobs:
Mutating Pods for OneAgent injection
Adds init containers / volume mounts / env vars so your app Pods load the OneAgent bits that come from the CSI driver.
Ensures the right binaries and libraries are available (e.g., via mounted volumes) and the process gets the proper preload/agent settings.
Respects opt-in/opt-out annotations/labels on namespaces and Pods (e.g. dynatrace.com/inject: "false" to skip a Pod).
Can also add Dynatrace metadata enrichment env/labels so the platform sees k8s context (workload, namespace, node, etc.).
Validating Dynatrace CRs (like DynaKube)
Schema and consistency checks: catches bad combinations (e.g., missing fields, wrong mode), so you don’t admit a broken config.
Helps avoid partial/failed rollouts by rejecting misconfigured specs early.
Hardening/compatibility tweaks
With certain features enabled, the mutating webhook helps ensure injected init containers comply with cluster policies (e.g., seccomp, PSA/PSS).
That’s why we recommend the annotation you’ve been using: feature.dynatrace.com/init-container-seccomp-profile: "true" It keeps Gatekeeper/PSA happy when it inspects the injected bits.
Why two dynatrace-webhook pods?
High availability for admission traffic. If one goes down, the other still serves the API server’s webhook calls.
How this ties into Gatekeeper/PSA
Gatekeeper (OPA) also uses validating admission.
The Dynatrace mutating webhook will first shape the Pod (add mounts/env/init).
Gatekeeper then validates the final Pod spec.
If you’re enforcing “must have seccomp/resources,” ensure Dynatrace’s injected init/sidecar also satisfies those rules (hence that seccomp annotation and resource limits you’ve set).
Dynatrace Active Gate
A Dynatrace ActiveGate acts as a secure proxy between Dynatrace OneAgents and Dynatrace Clusters or between Dynatrace OneAgents and other ActiveGates—those closer to the Dynatrace Cluster. It establishes Dynatrace presence—in your local network. In this way it allows you to reduce your interaction with Dynatrace to one single point—available locally. Besides convenience, this solution optimizes traffic volume, reduces the complexity of the network and cost. It also ensures the security of sealed networks.
The docs on Active Gate and version compatibility with Dynakube are not yet mature. Ensure the following:
With Dynatrace Operator 1.7 the v1beta1 and v1beta2 API versions for the DynaKube custom resource were removed.
ActiveGates up to and including version 1.323 used to call the v1beta1 endpoint. Starting from ActiveGate 1.325, the DynaKube endpoint was changed to v1beta3 Ensure your ActiveGate is up to date with the latest version.
As part of our ongoing platform reliability work, we’ve introduced explicit CPU and memory requests/limits for all Dynatrace components running on AKS.
🧩 Why it matters
Previously, the OneAgent and ActiveGate pods relied on Kubernetes’ default scheduling behaviour. This meant:
No guaranteed CPU/memory allocation → possible throttling or eviction during cluster load spikes.
Risk of noisy-neighbour effects on shared nodes.
Unpredictable autoscaling signals and Dynatrace performance fluctuations.
Setting requests and limits gives the scheduler clear boundaries:
Requests = guaranteed resources for stable operation
Limits = hard ceiling to prevent runaway usage
Helps Dynatrace collect telemetry without starving app workloads
These values were tuned from observed averages across DEV, UAT and PROD clusters. They provide a safe baseline—enough headroom for spikes while keeping node utilisation predictable.
Hey there, savvy tech enthusiasts and cloud aficionados! If you’re anything like us, you’ve probably been keeping an eye on the economic tides as companies navigate the choppy waters of a recession. In times like these, every penny counts, and the IT world is no exception. With companies tightening their belts and trimming their workforces, it’s more important than ever to find creative ways to save big without sacrificing performance. Well, hold onto your keyboards, because we’ve got a cloud solution that’s about to make your wallets smile: Azure Spot Instances!
Azure Spot Instances: Catching the Cost-saving Wave
Picture this: azure skies, azure waters, and Azure Spot Instances—your ticket to slashing cloud costs like a pro. What are Azure Spot Instances, you ask? Well, they’re like the rockstar bargain of the cloud world, offering significant savings by leveraging unutilized Azure capacity. It’s like snagging a front-row seat at a concert for a fraction of the price, but instead of music, you’re rocking those cost-cutting beats.
So, here’s the scoop: Azure Spot Instances are like the cool kids in the virtual playground. They’re virtual machine scale sets that thrive on filling up the unused capacity gaps in the Azure cloud. Think of them as the ultimate budget-friendly roommates who crash on your couch when they’re not partying elsewhere. But wait, there’s a catch (of the best kind): they’re perfect for workloads that can handle a bit of a hiccup. We’re talking batch processing jobs, testing environments, and compute-intensive tasks that don’t mind a little dance with interruption.
Don’t Just Save, Make it Rain Savings
Now, imagine this scenario: you’ve got your AKS (Azure Kubernetes Service) cluster humming along, and you’re hosting your Dev and UAT environments. The spotlight is on your Spot Instances—they’re not the main act (that’s for staging and production), but they steal the show when it comes to saving money. So, let’s break it down.
With Azure Spot Instances, you’re not just pinching pennies; you’re saving big bucks. These instances are the economy class of the cloud world, with no high availability guarantees. If Azure needs space, the not-so-glamorous eviction notice might come knocking. But, hey, for Dev and UAT environments that can handle the occasional hiccup, it’s like getting bumped to first class on a budget.
Setting Sail with Spot Instances
Now that we’ve got your attention, let’s dive into the fun part—getting started! First things first, you need an AKS cluster that’s already playing nice with multiple node pools. And guess what? Your Spot Instance pool can’t be the default—it’s the star of the show, but it’s gotta know its role.
Using the Azure CLI, you’ll unleash the magic with a few commands. It’s like casting a spell, but way more practical. Picture yourself conjuring cost savings from thin air—pretty magical, right? Just create a node pool with the priority set to “Spot,” and voilà! You’re on your way to cloud cost-cutting greatness.
The Caveats, but Cooler
Now, before you go all-in on Spot Instances, remember, they’re not for every situation. These instances are the fearless daredevils of the cloud, ready to tackle evictions and interruptions head-on. But, just like you wouldn’t invite a lion to a tea party, don’t schedule critical workloads on Spot Instances. Set up taints and tolerations to ensure your instances dance only with the tasks that love a bit of unpredictability.
You can also leverage affinity roles to schedule your pod of dolphins on spot nodes with affinity labels.
Ready for the grand finale? Upgrading your Spot Instances is a breeze, and the best part is, AKS issues an eviction notice, not a complete storm-out. Plus, you can set a max price that works for you. Think of it like setting a budget for a shopping spree—except you’re not splurging on unnecessary costs.
So, there you have it, cloud trailblazers! Azure Spot Instances are the secret sauce to saving big during these recession times. With the right mindset, a sprinkle of taints, and a dash of tolerations, you’ll be riding the wave of cost-cutting success like a pro. Remember, it’s not just about saving money—it’s about making every cloud resource count. So go ahead, grab those Spot Instances by the horns and ride the cost-saving currents like the cloud-savvy superhero you were meant to be! 🚀🌩️
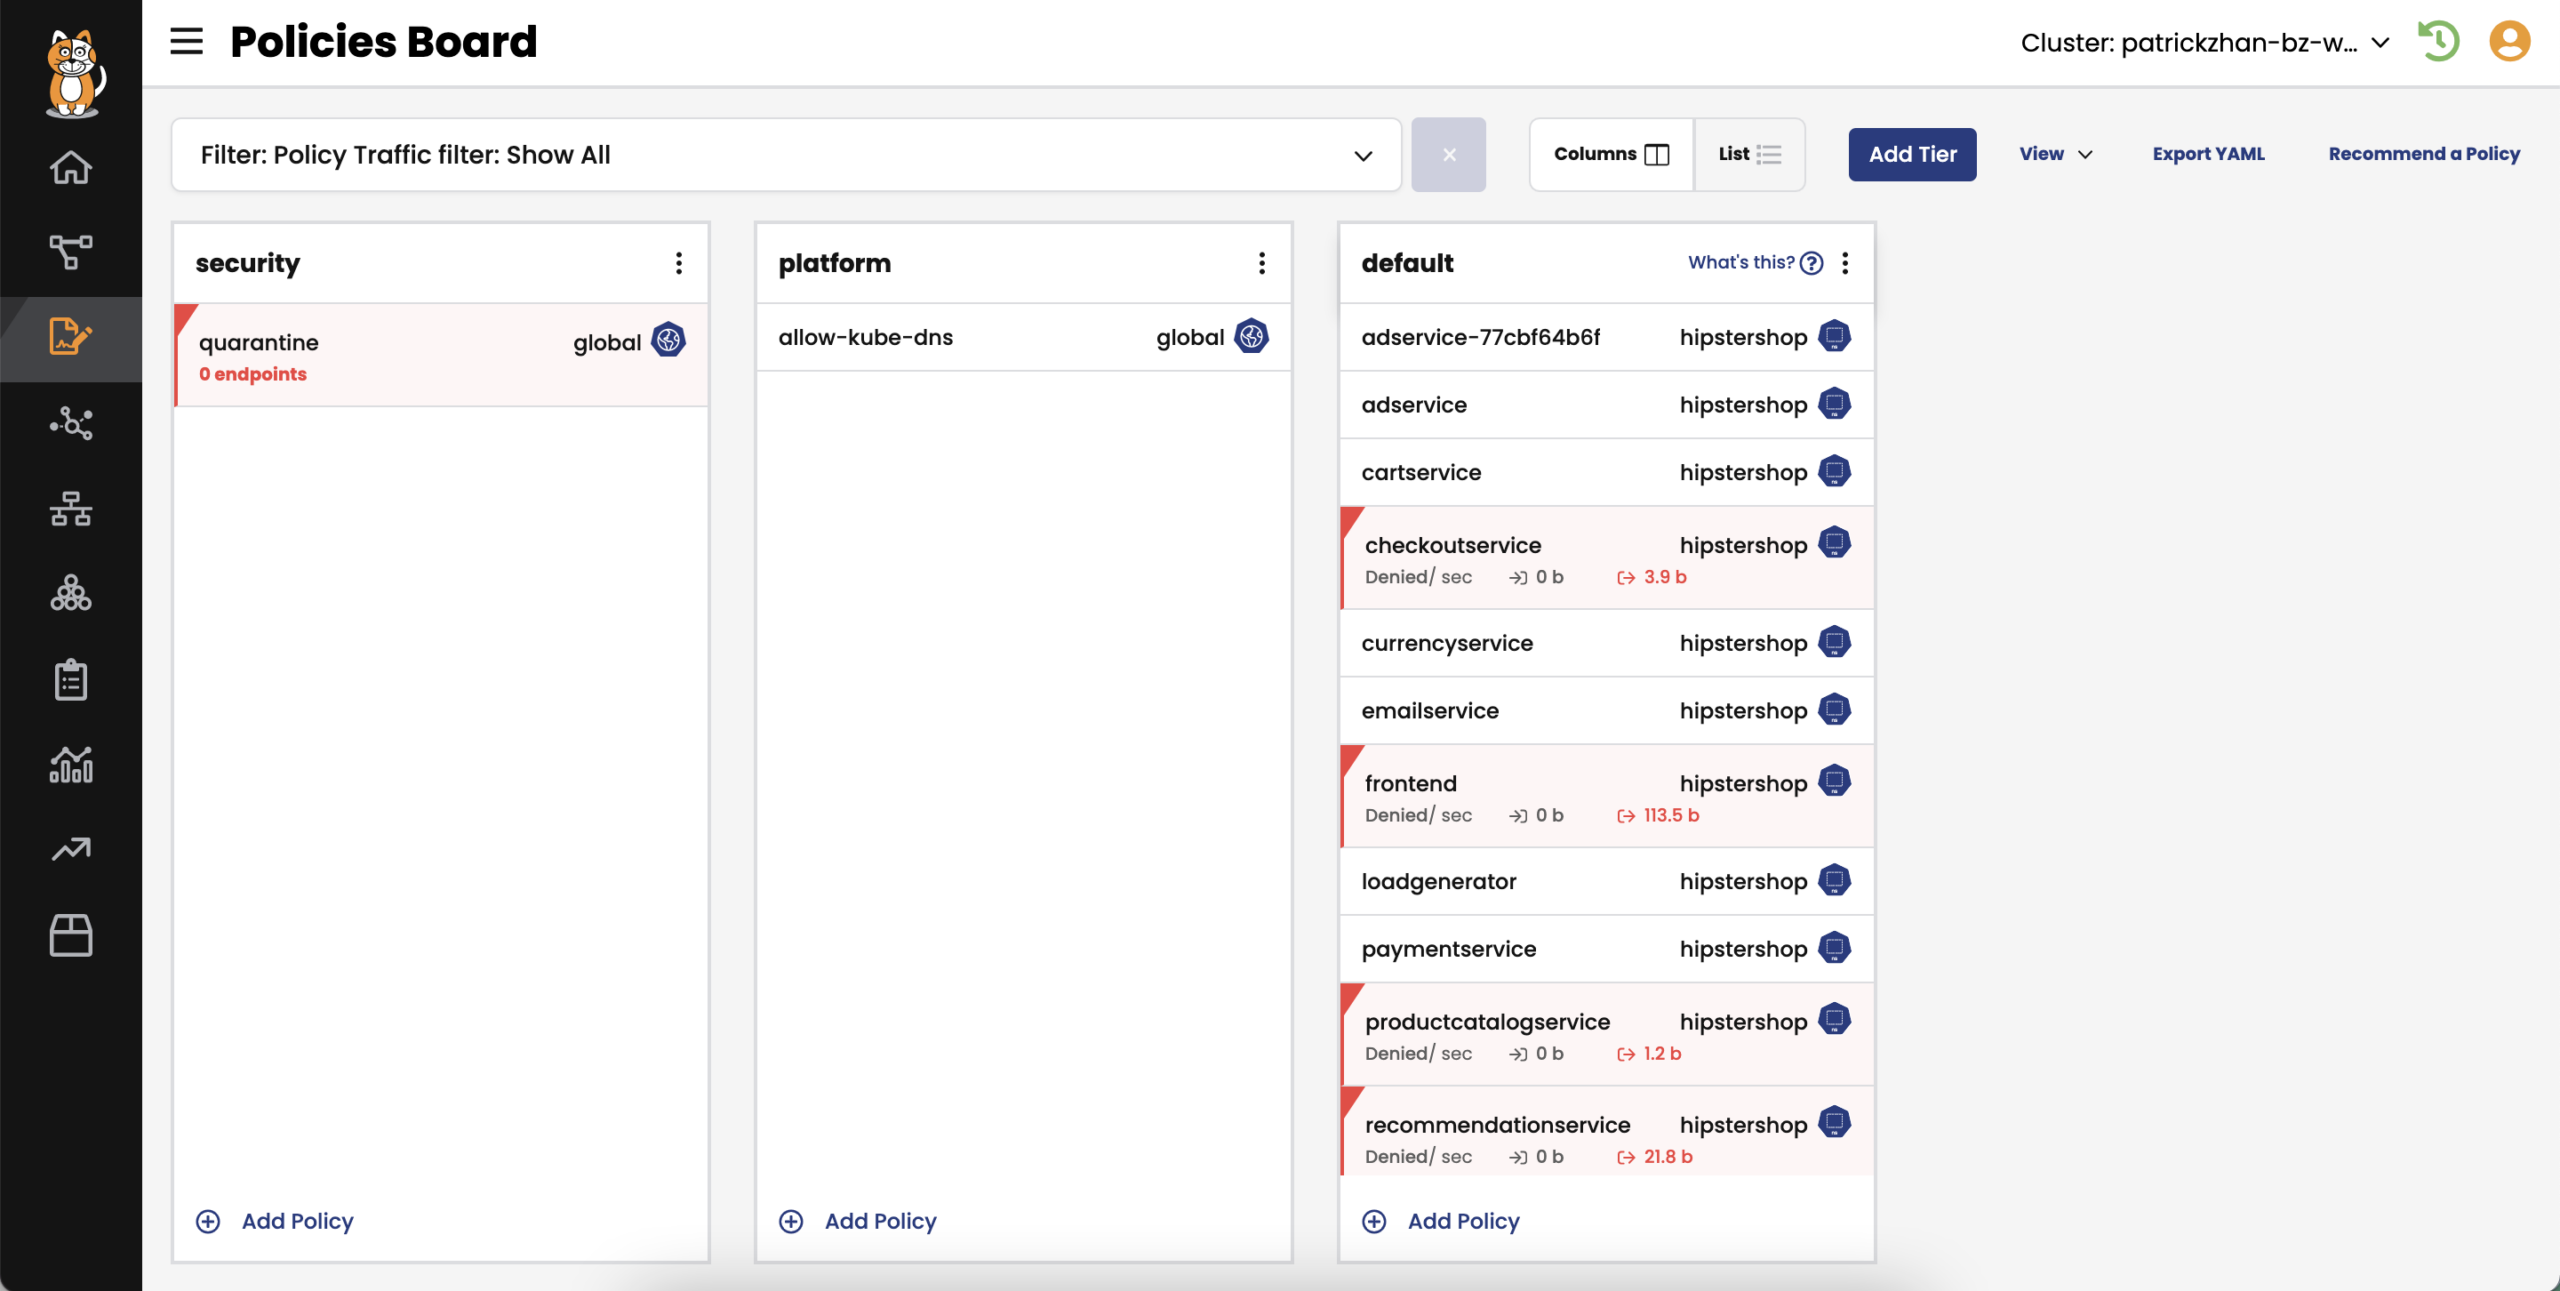
In the ever-evolving world of technology, securing Kubernetes clusters has become a paramount concern for organizations. With the rise of cloud-native applications and microservices architectures, the need for a robust security solution has become more crucial than ever. This is where Calico Cloud from Tigera shines as an exceptional tool to enhance the security posture of a Kubernetes cluster.
Calico Cloud offers a comprehensive set of features and capabilities specifically designed to address the unique security challenges of Kubernetes environments. By leveraging its advanced networking and security capabilities, Calico Cloud empowers organizations to protect their clusters against various threats, enforce granular security policies, and gain deep visibility into their network traffic.
Course vs. Fine-Grain Policies:
One of the key aspects that make Calico Cloud an excellent choice for improving the security posture of a Kubernetes cluster is its ability to enforce both course and fine-grain security policies. These policies act as guardrails to ensure that only authorized traffic flows within the cluster, mitigating the risks of unauthorized access, data breaches, and lateral movement by malicious actors.
Course-grain policies enable administrators to define high-level security rules that apply to entire namespaces or the entire cluster. These policies help establish a strong foundation for security by setting broad guidelines such as allowing or denying traffic between namespaces, restricting external access to certain services, or implementing network segmentation. Course-grain policies are easy to define and manage, making them suitable for organizations looking for initial security controls.
On the other hand, fine-grain policies offer a more granular level of control over network traffic within the Kubernetes cluster. These policies allow administrators to define rules based on specific labels, namespaces, IP addresses, or other metadata associated with pods and services. With fine-grain policies, organizations can precisely control which pods can communicate with each other, what protocols and ports are allowed, and even enforce encryption requirements. Fine-grain policies provide a high level of flexibility and customization, enabling organizations to tailor their security controls according to their specific requirements.
By offering both course and fine-grain policies, Calico Cloud allows organizations to strike a balance between simplicity and flexibility in securing their Kubernetes clusters. It provides a unified platform to manage and enforce these policies, simplifying the overall security management process.
Zero-trust Workload Security
Implement zero-trust workload access controls for traffic to and from individual pods to external endpoints on a per-pod basis to protect your Kubernetes cluster. Author DNS policies that implement fine-grained access controls between a workload and the external services it needs to connect to, like Amazon RDS, ElasticCache, and more.
Limit the blast radius when a security breach results in an APT (advanced persistent threat) with identity-aware microsegmentation for both container and VM workloads. Use a single policy framework and Kubernetes declarative model to set controls at the host, container/VM, and application levels.
Extend the use of existing firewalls and SIEMs to your Kubernetes environment with out-of-the-box firewall and SIEM integrations.
KEY FEATURES INCLUDE
Zero-trust workload access controls
Identity-aware microsegmentation for workloads
Firewall and SIEM integration
Envoy-based application-level protection
Conclusion:
In conclusion, Calico Cloud from Tigera is an outstanding tool for enhancing the security posture of Kubernetes clusters. Its advanced networking and security capabilities, coupled with the ability to enforce course and fine-grain policies, make it a comprehensive solution to protect against threats and enforce robust security controls. With Calico Cloud, organizations can achieve a higher level of confidence in the security of their Kubernetes deployments, ensuring the integrity, confidentiality, and availability of their applications and data.
Calico Cloud has proven instrumental in protecting our kubernetes cluster infrastructure at scale. Allowing us to control both North-South and East-West traffic.
What usually happens is that you will initially install the chart and by default your kubernetes PV will have a default policy of DELETE. This means if you uninstall the chart, the Persistent Volume in the cloud (Azure, AWS, GCP etc) will also be deleted. Not a great outcome if you want historic metrics.
What you want is a PV that has a reclaim policy of retain, so that when the chart is every uninstalled, your managed disks in the cloud are retained.
So how do you go about doing this?
Install the chart initially with a persistent volume configured in the values files for Prometheus. (The default way)
Configure Grafana correctly on the first install.
Stage 1
Prometheus
We using managed GKE/GCP, so standard storage class is fine, your cloud provider may be different.
Configure your Prometheus Operator chart with the following in the values file.
Once the chart is deployed, go to your cloud provider and note the disk id’s. I am using GCP. So I note them down here:
In the above, the Name column is the disk id for GCP. Azure/AWS will be different e.g. Disk URI etc.
Go back to your helm chart repository and lets alter the chart so that Prometheus and Grafana are always bound to this disks, even if you uninstall the chart.
Prometheus
If you would like to keep the data of the current persistent volumes, it should be possible to attach existing volumes to new PVCs and PVs that are created using the conventions in the new chart. For example, in order to use an existing Azure disk for a helm release called `prometheus-operator` the following resources can be created:
Note down the RELEASE NAME of your prometheus operator chart. Mine is called prometheus operator.
Configure the following yaml template. This is a HACK. By making the name of the PV and PVC EXACTLY the same as the chart. Prometheus will reuse the PV/PVC.
With the above in place, you will be able to rerun chart installs for updates and uninstall the chart. Your final check is to ensure the PVs are RETAIN and not on the DELETE policy.
One of the key pillars regarding SRE is being able to make quantitative decisions based on key metrics.
The major challenge is what are key metrics and this is testament to the plethora of monitoring software out in the wild today.
At a foundational level you want to ensure your services are always running, however 100% availability in not practical.
Class SRE implements Devops
{
  MeasureEverything()
}
Availability/Error Budget
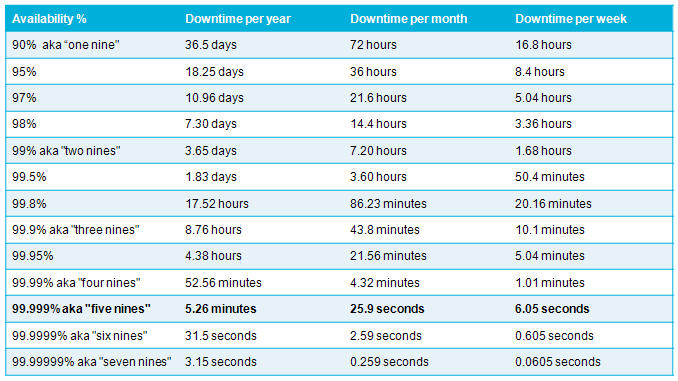
You then figure out what availability is practical for your application and services.
Availability
Your error budget will then be the downtime figure e.g. 99% is 7.2 hours of downtime a month that you can afford to have.
SLAs, SLOs and SLIs
This will be the starting point on your journey to implementing quantitative analysis to
Service Level Agreements
Service Level Objectives
Service Level Indicators
This blog post is all about how you can measure Service Level Objectives without breaking the bank. You do not need to spend millions of dollars on bloated monitoring solutions to observe key metrics that really impact your customers.
Just like baking a cake, these are the ingredients we will use to implement an agile, scaleable monitoring platform that is solely dedicated to doing one thing well.
Outcome
This is what we want our cake to deliver:
Measuring your SLA Compliance Level
Measuring your Error Budget Burn Rate
Measuring if you have exhausted your error budget
Service Level Compliance – SLAs -> SLOs -> SLIs
If you look at the cake above, you can see all your meaningful information in one dashboard.
Around 11am the error budget burn rate went up. (A kin to your kids spending all their pocket money in one day!)
Compliance was breached (99% availability) – The purple line (burn rate) went above the maximum budget (yellow line)
These are metrics you will want to ALERT on at any time of the day. These sort of metrics matter. They are violating a Service Level Agreement.
What about my other metrics?
Aaaah, like %Disk Queue Length, Processor Time, Kubernetes Nodes/Pods/Pools etc? Well…
I treat these metrics as second class citizens. Like a layered onion. Your initial metrics should be – Am I violating my SLA? If not, then you can use the other metrics that we have enjoyed over the decades to compliment your observeability into the systems and as a visual aid for diagnostics and troubleshooting.
Alerting
Another important consideration is the evolution of infrastructure. In 1999 you will have wanted to receive an alert if a server ran out of disk space. In 2020, you are running container orchestration clusters and other high availability systems. A container running out of disk space is not so critical as it used to be in 1999.
Evaluate every single alert you have and ask yourself. Do I really need to wake someone up at 3am for this problem?
Always alert on Service Level Compliance levels ABOUT to breach
Always alert on Error Budget Burn Rates going up sharply
Do not alert someone out of hours because the CPU is 100% for 5 minutes unless Service Level Compliance is being affected to
You will have happier engineers and a more productive team. You will be cooled headed during an incident because you know the different between a cluster node going down versus Service Level Compliance violations. Always solve the Service Level Compliance and then fix the other problems.
Ingredients
Where are the ingredients you promised? You said it will not break the bank, I am intrigued.
A Kubernetes cluster – Google, Azure Kubernetes Services etc
ArgoCD – Argo CD is a declarative, GitOps continuous delivery tool for Kubernetes.
In this post we have touched on the FOUNDATION of what we want out of monitoring.
We know exactly what we want to measure – Service Level Compliance, Error Budget Burn Rate and Max Budget. All this revolves around deciding on the level of availability we give a service.
We touched on the basic ingredients that we can use to build this solution.
In my next blog post we will discuss how we mix all these ingredients together to provide a platform that is is good at doing one thing well.
Measuring Service Level Compliance & Error Budget Burn Rates
When you give your child $30 to spend a month and they need to save $10 a month. You need to be alerted if they spending too fast (Burn Rate).
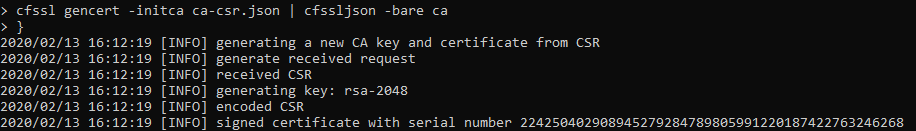
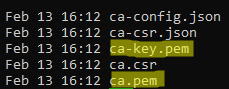
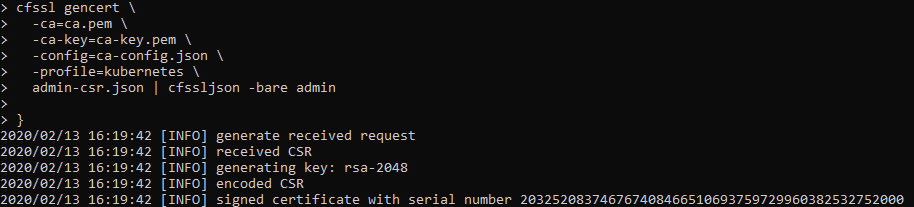
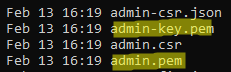
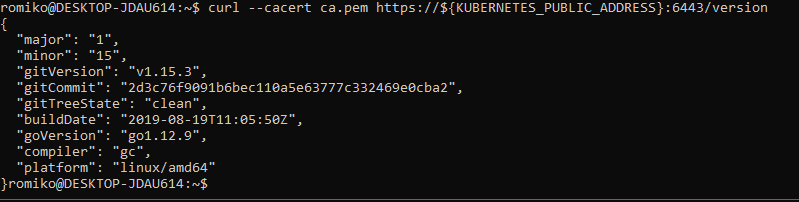
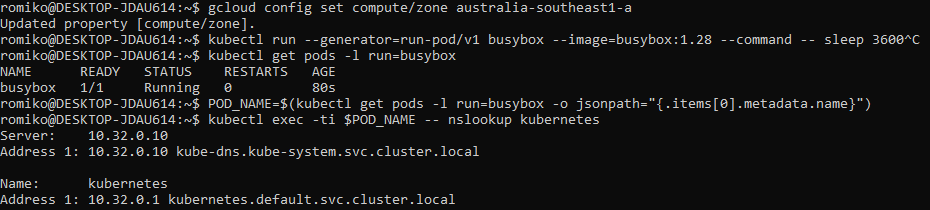
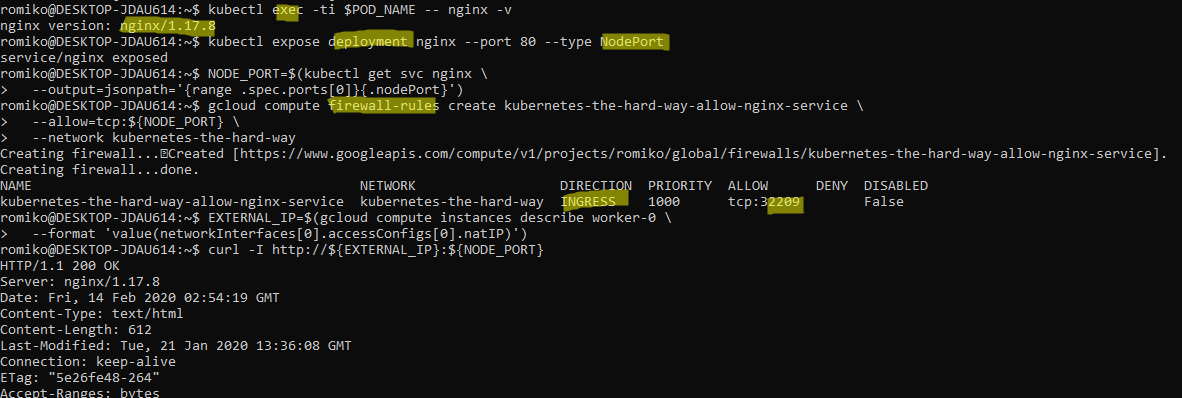
This is a visual guide to compliment the process of setting up your own Kubernetes Cluster on Google Cloud. This is a visual guide to Kelsey Hightower GIT project called Kubernetes The Hard Way. It can be challenging to remember all the steps a long the way, I found having a visual guide like this valuable to refreshing my memory.
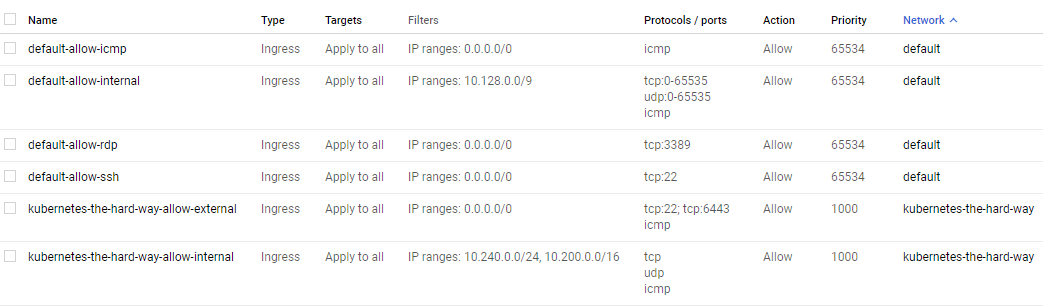
Provision the network in Google Cloud
VPC
Provision Network
Firewall Rules
External IP Address
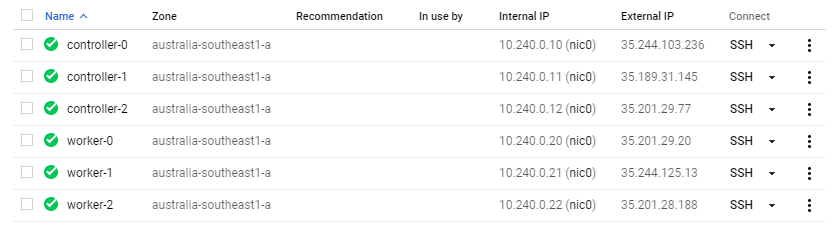
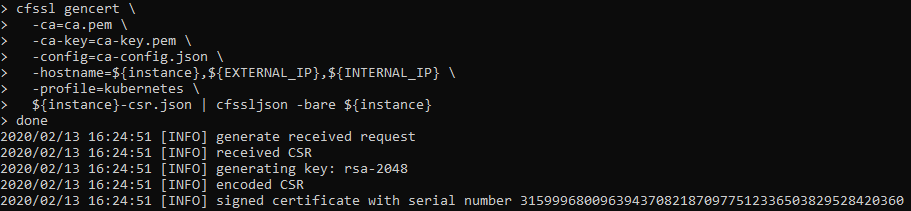
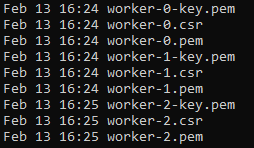
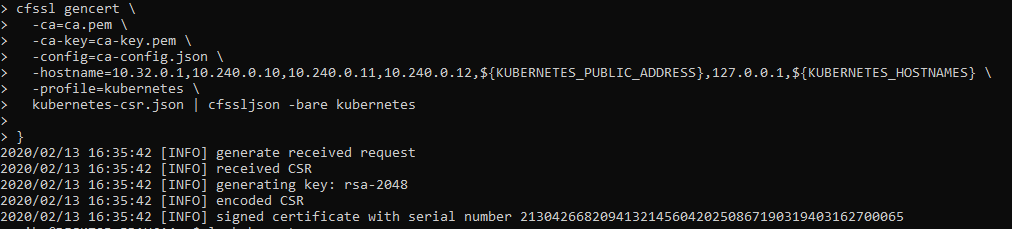
Provision Controllers and Workers – Compute Instances
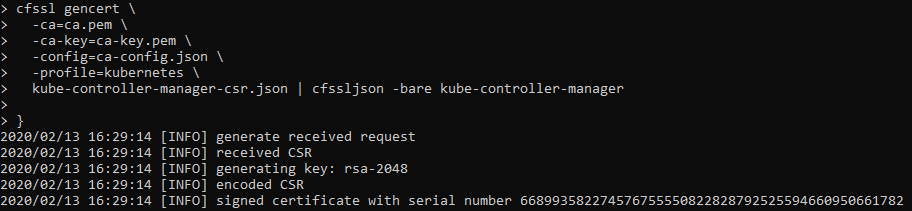
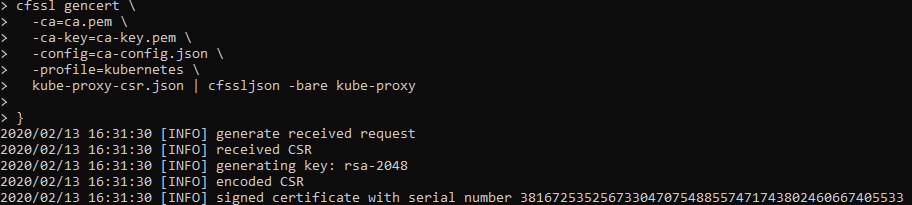
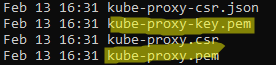
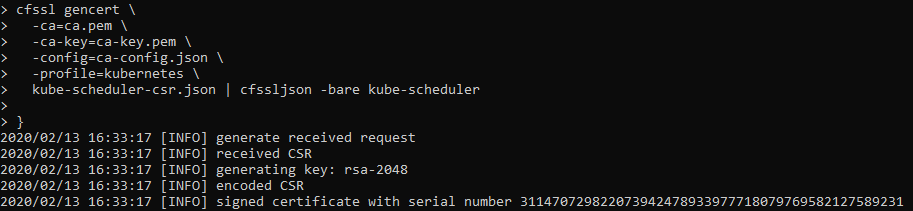
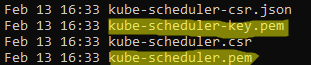
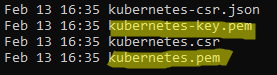
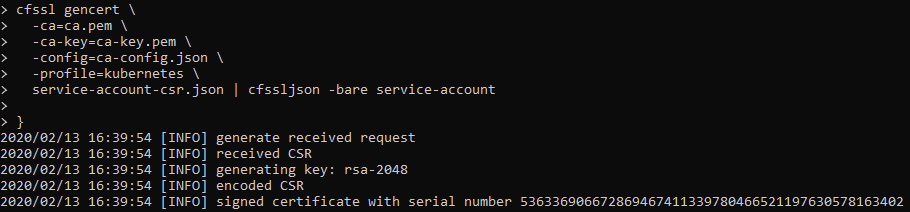
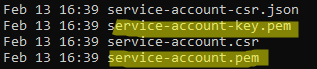
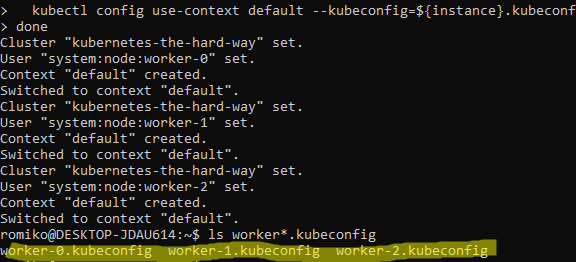
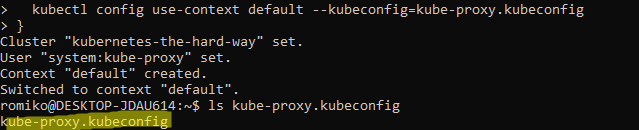
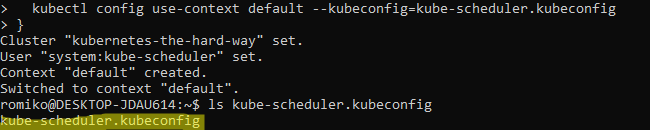
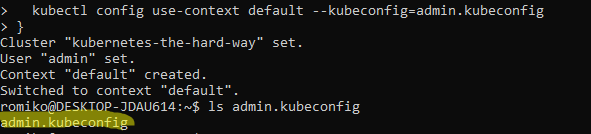
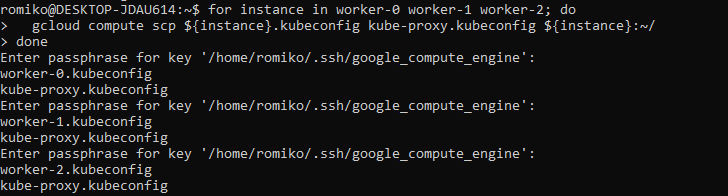
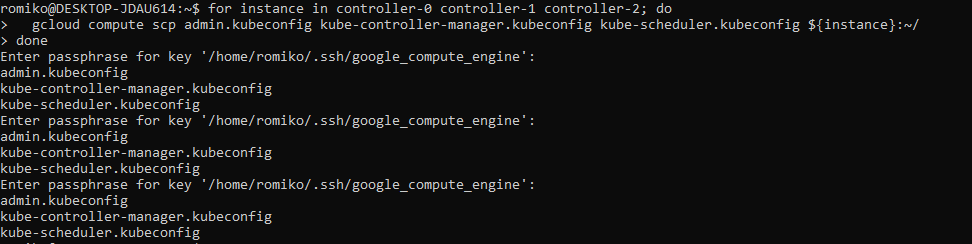
Generating Kubernetes Configuration Files for Authentication
Generating the Data Encryption Config and Key
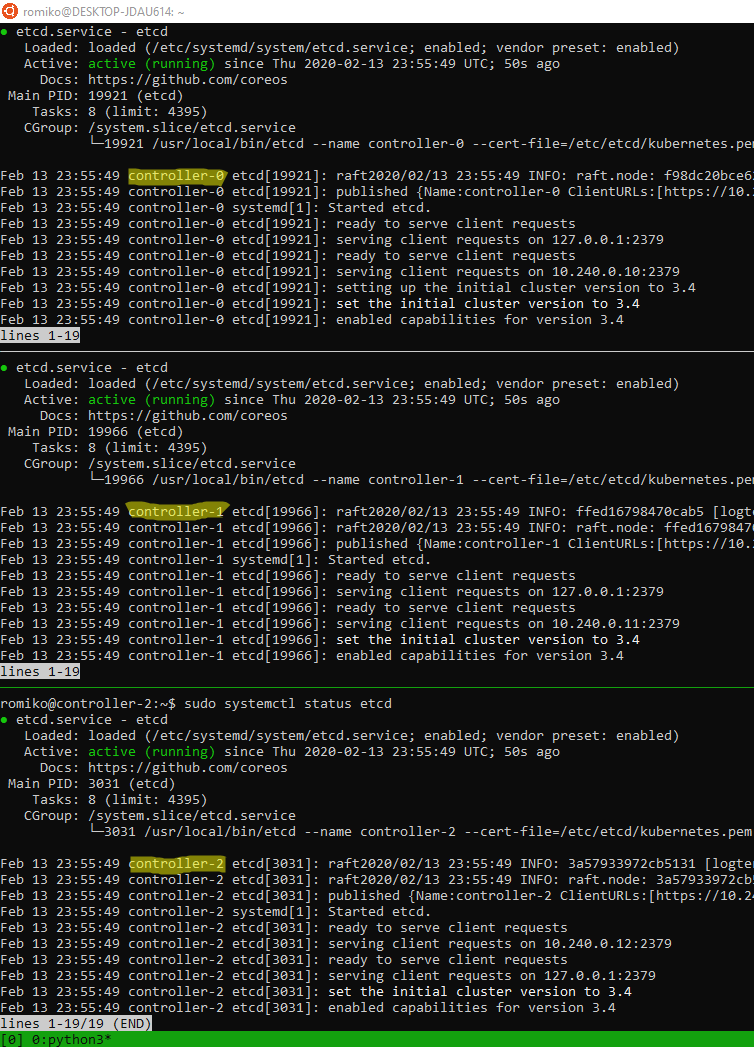
Bootstrapping etcd cluster
Use TMUX set synchronize-panes on to run on multiple instances at same time. Saves time!
Notice where are using TMUX in a Windows Ubuntu
Linux Subsystem and running commands in parallel to save a lot of time.
The only manual command is actually ssh into each controller, once in, we activate tmux synchronize feature. So what you type in one panel will duplicate to all others.
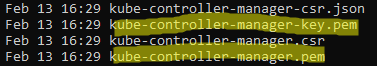
Bootstrapping the Control Pane (services)
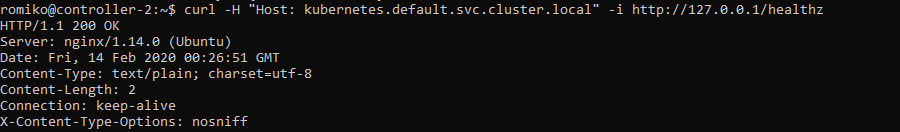
Bootstrapping the Control Pane (LB + Health)
Required Nginx as Google health checks does not support https
Once you have completed the install of your kubernetes cluster, ensure you tear it down after some time to ensure you do not get billed for the 6 compute instances, load balancer and public statis ip address.
A big thank you to Kelsey for setting up a really comprehensive instruction guide.
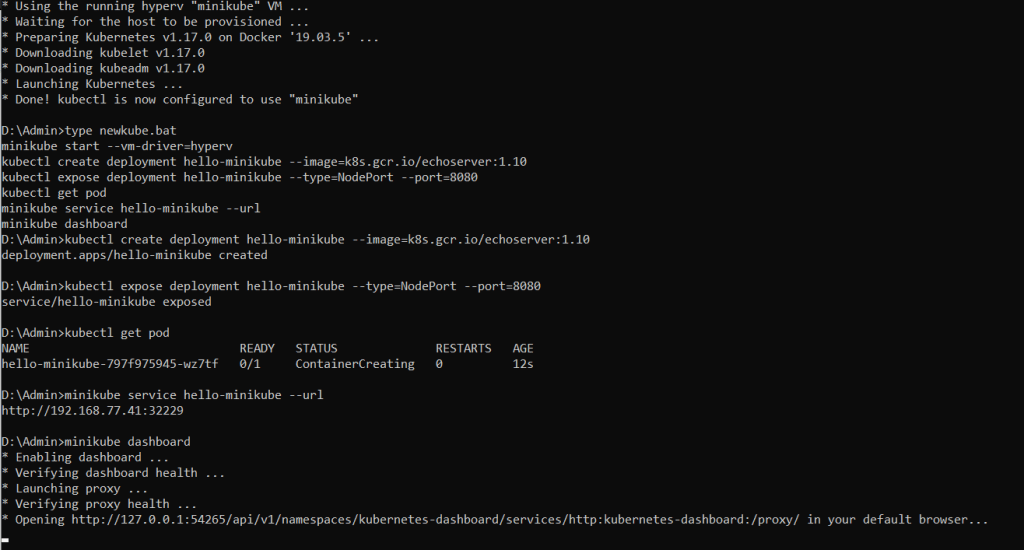
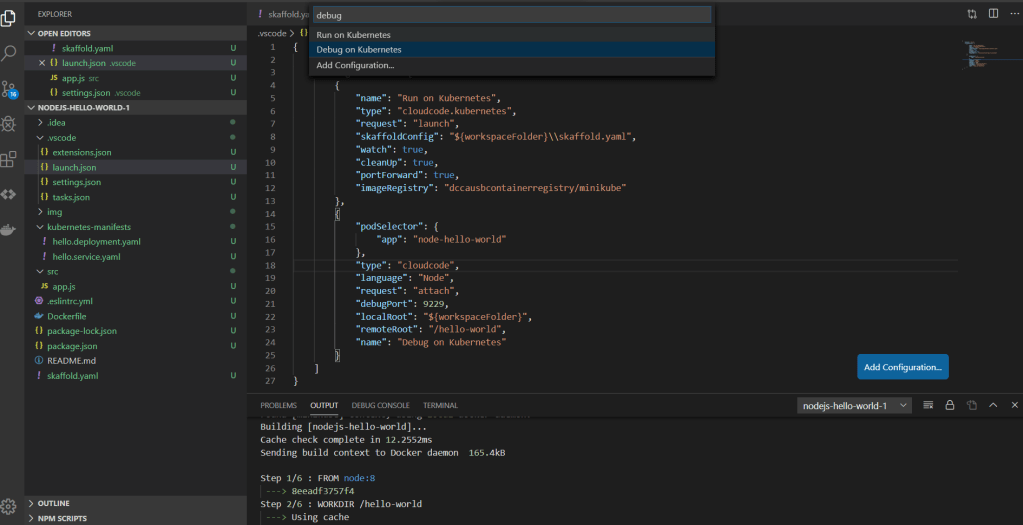
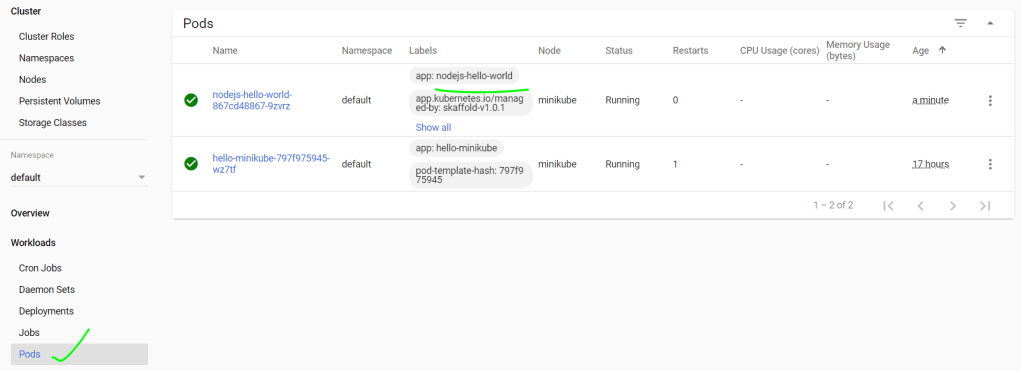
As a developer you can deploy your docker containers to a local Kubernetes cluster on your laptop using minikube. You can then use Google Cloud Code extension for Visual Studio Code.
You can then make real time changes to your code and the app will deploy in the background automatically.
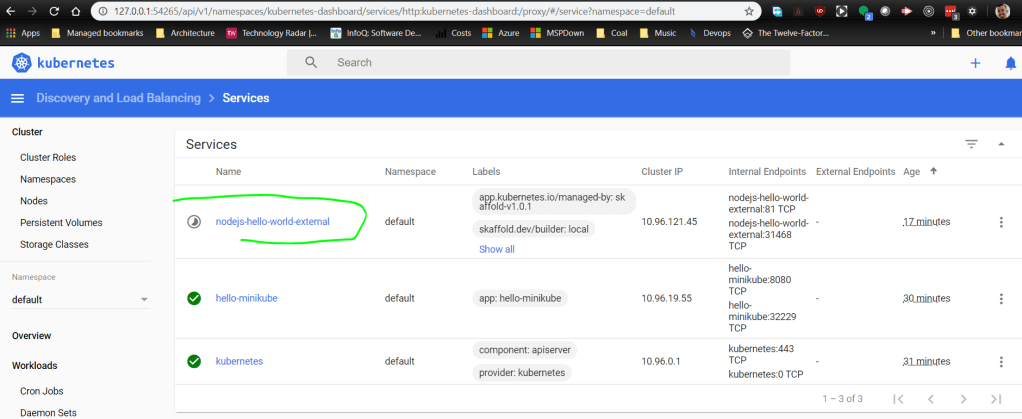
We can see our new service is being deployed by VSCode Cloud Code extension. Whenever we make changes to the code, it will automatically deploy.
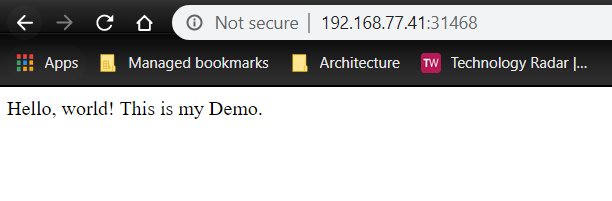
minikube service nodejs-hello-world-external --url
The above command will give us the url to browse the web app.
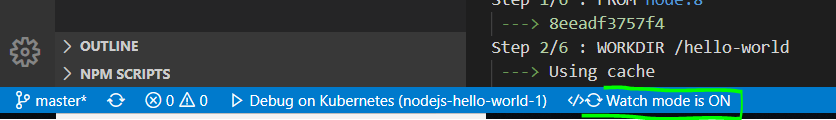
If I now change the text for Hello, world! It will automatically deploy. Just refresh the browser 🙂
Here in the status bar we can see deployments as we update code.
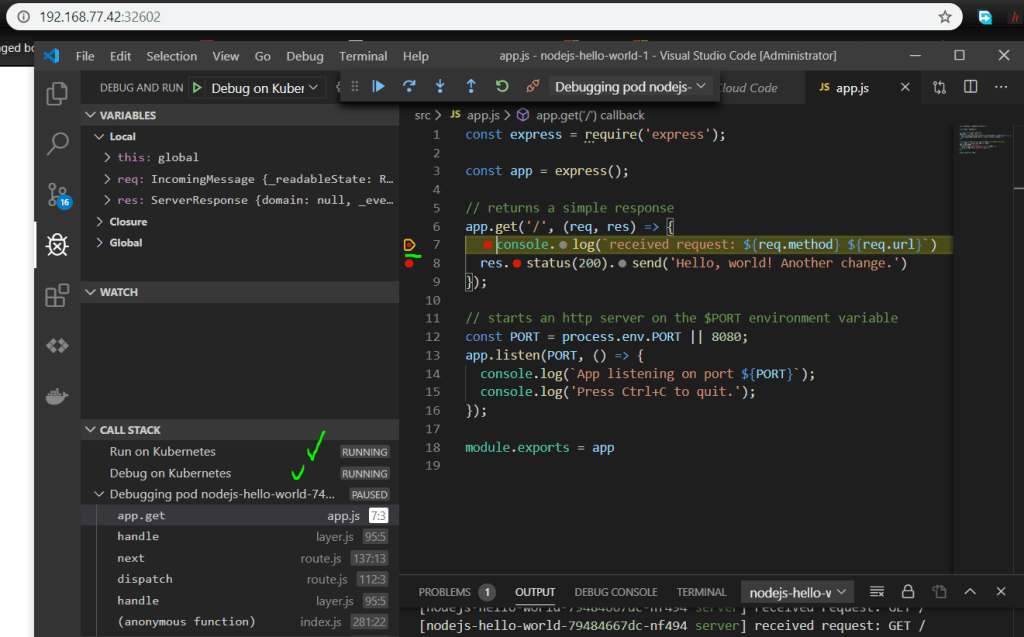
Debugging
Once you have deployed your app to Minikube, you can then kick off debugging. This is pretty awesome. Basically your development environment is now a full Kubernetes stack with attached debugging proving a seamless experience.


You must be logged in to post a comment.