When it comes to deploying enterprise environments in Azure, managing complexity effectively is crucial. The Microsoft Cloud Adoption Framework (CAF) for Azure advocates for using multiple state files to configure various landing zones—this helps to balance risk, manage lifecycles, and accommodate diverse team functions more effectively. The traditional challenges associated with managing multiple state files can be mitigated through what we call “code-less composition,” which is an innovative approach facilitated by Terraform.
What is Code-less Composition?
In the realm of Terraform, every state file potentially interacts with others. Traditionally, configuring these interactions required manual scripting, which could be error-prone and tedious. Code-less composition simplifies this by allowing state files’ outputs to be used as input variables for another landing zone without writing any lines of code.
This feature is particularly valuable in complex architectures where you need to manage dependencies and configurations across multiple landing zones automatically. Essentially, it allows for seamless and scalable infrastructure as code practices.
How Does It Work in Azure with Terraform?
Terraform facilitates this through a feature that reads the state file’s output from one landing zone and uses it as input for another. This process is implemented through a simple variable in the Terraform configuration, vastly simplifying the setup of complex configurations. Here’s a look at how you can utilize this in your Azure environment:
Example Configuration for a Management Landing Zone
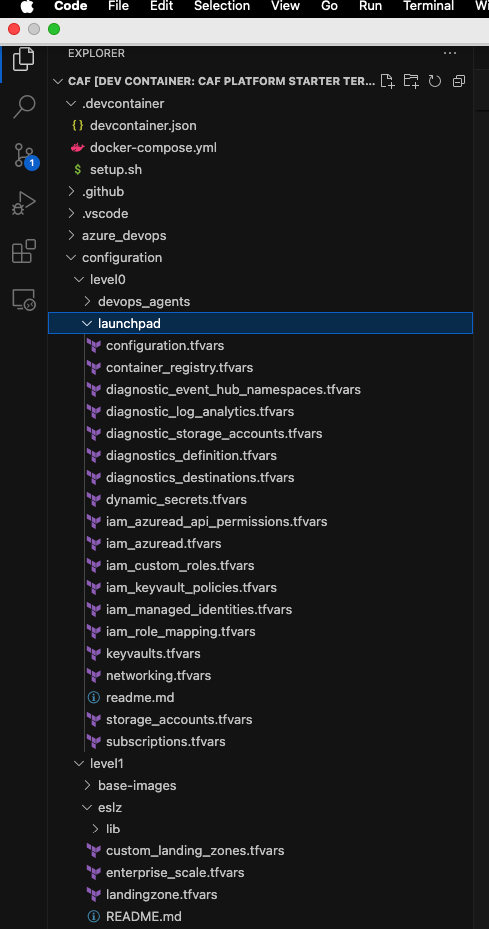
Consider a management landing zone configured at level 1:
In this configuration, tfstates is an object where you specify the Terraform state file to load. For instance, the launchpad object loads the caf_launchpad.tfstate from a workspace (or storage container) called tfstate located one level lower. This setup indicates that any objects within this landing zone can refer to objects deployed in the same or a lower deployment level.
Referencing Resources Across Levels
For deploying resources that depend on configurations from another level, you can reference the necessary elements directly through your configurations:
This snippet showcases how to deploy an automation account within a resource group provisioned in a lower level, demonstrating the composability of the framework.
Handling External Objects
When dealing with resources that are not deployed through Terraform or are managed outside of the Azure CAF object model, you can still reference these using their resource names or IDs:
The hierarchy model of Azure CAF allows for global settings and diagnostics settings to be applied across all levels, ensuring consistent application of configurations like supported regions, naming conventions, and tag inheritance.
Conclusion
Code-less composition in Azure using Terraform represents a significant step forward in infrastructure automation. By reducing the need for manual coding, it not only minimizes human error but also speeds up the deployment process, allowing IT teams to focus more on strategic initiatives rather than getting bogged down by configuration complexities. This approach aligns with modern DevOps practices, offering a scalable, repeatable, and efficient method for managing cloud resources.
In cloud architecture and DevOps, managing secrets securely is paramount. Azure Key Vault provides a robust solution by enabling the secure storage of secrets, keys, and certificates. However, integrating Azure Key Vault with Azure DevOps through the AzureKeyVault@ task can present unique challenges, mainly when dealing with empty secrets. This blog post delves into these challenges and provides a practical workaround, which is especially useful when bootstrapping environments with Terraform.
The Challenge with Empty Secrets
When using Terraform, specifically with the Cloud Adoption Framework (CAF) Super Module, to bootstrap an environment, you might encounter a scenario where certain secrets in Azure Key Vault are intended to be empty. This could be by design, especially in dynamic environments where secret values are not immediately available or required. A typical example is the initialization of SSH keys for virtual machine scale sets (VMSS).
Note: It is impossible to have an empty secret in Keyvault if done via the portal, but who uses the Azure Portal nowadays, Flinstone?
However, when using the AzureKeyVault@ task in Azure DevOps pipelines to fetch these secrets, a peculiar behavior is observed: if a secret is empty, the task does not map it to a variable. Instead, the variable’s value defaults to the variable’s name. This behaviour can lead to unexpected results, especially when the presence or content of a secret dictates subsequent pipeline logic.
Understanding the Workaround
To effectively manage this situation, a strategic approach involves testing for valid secret values before proceeding with operations that depend on these secrets. Specifically, we employ pattern matching or regular expressions to verify that the secrets fetched from Azure Key Vault contain expected values.
Below is a simplified explanation of how to implement this workaround in an Azure DevOps pipeline:
Fetch Secrets with AzureKeyVault@ Task: Initially, use the AzureKeyVault@ task to attempt retrieving the desired secrets from Azure Key Vault, specifying the necessary parameters such as azureSubscription and KeyVaultName.
Validate Secret Values in a Bash Task: Following the retrieval, incorporate a Bash task to validate the contents of these secrets. The logic involves checking if the secret values meet predefined patterns. For SSH keys, for instance, public keys typically begin with ssh-rsa, and private keys contain BEGIN OPENSSH PRIVATE KEY.
Handle Empty or Invalid Secrets: If the secrets do not meet the expected patterns—indicative of being empty or invalid—proceed to generate new SSH key pairs and set them as pipeline variables. Furthermore, upload these newly generated keys back to Azure Key Vault for future use.
Success and Error Handling: Proceed with the intended operations upon successful validation or generation of secrets. Ensure that error handling is incorporated to manage failures, mainly when uploading keys to Azure Key Vault.
Code Implementation
Here’s a code snippet illustrating the key parts of this workaround: Note that you can access pipeline variables in three ways in Bash Scripts
For the sake of this blog post, I will demonstrate all three approaches.
steps:
  - task: AzureKeyVault@2
    inputs:
      azureSubscription: ${{ parameters.azureSubscription }}
      KeyVaultName: ${{ parameters.keyVaultName }}
      SecretsFilter: 'vmss-img-public-key, vmss-img-private-key'
  - task: Bash@3
    displayName: 'Manage SSH Key'
    inputs:
      targetType: 'inline'
      script: |
        set -e  # Exit immediately if a command exits with a non-zero status.
        set -o pipefail # Makes pipeline return the exit status of the last command in the pipe that failed
        # Check if the keys exist in the Azure Key Vault
        if [[ $VMSS_IMG_PUBLIC_KEY != ssh-rsa* ]] || [[ $VMSS_IMG_PRIVATE_KEY != *"BEGIN OPENSSH PRIVATE KEY"* ]]; then
          # Generate the SSH key pair
          ssh-keygen -t rsa -b 2048 -f "$(Build.SourcesDirectory)/sshkey" -q -N ""
          echo "SSH key pair generated."

          # Read public key and set it as a pipeline variable
          VMSS_IMG_PUBLIC_KEY=$(cat "$(Build.SourcesDirectory)/sshkey.pub")
          VMSS_IMG_PRIVATE_KEY=$(cat "$(Build.SourcesDirectory)/sshkey")
          echo "##vso[task.setvariable variable=vmss-img-public-key]$VMSS_IMG_PUBLIC_KEY"
          echo "##vso[task.setvariable variable=vmss-img-private-key]$VMSS_IMG_PRIVATE_KEY"

          # Upload the public key to Azure Key Vault
          az keyvault secret set --name vmss-img-public-key --vault-name "$KEYVAULT_NAME" --file "$(Build.SourcesDirectory)/sshkey.pub" || {
            echo "Failed to upload the public key to Azure Key Vault."
            exit 1
          }

          # Upload the private key to Azure Key Vault
          az keyvault secret set --name vmss-img-private-key --vault-name "$KEYVAULT_NAME" --file "$(Build.SourcesDirectory)/sshkey" || {
            echo "Failed to upload the private key to Azure Key Vault."
            exit 1
          }
        else
          echo "Skipping SSH Key generation, keys already present in Key Vault: $KEYVAULT_NAME"
          echo "Public Key in Keyvault $KEYVAULT_NAME is: $(vmss-img-public-key)"
        fi
    env:
      KEYVAULT_NAME: ${{ parameters.keyVaultName }}
      VMSS_IMG_PUBLIC_KEY: $(vmss-img-public-key)
      VMSS_IMG_PRIVATE_KEY: $(vmss-img-private-key)
The above script can be simplified and use better regular expressions and does not require a lot of verbose output, this is here to demonstrate different ways to access the variables vmss-img-public-key and vmss-img-private-key.
For the Bash guru’s out there, you might say, why not check for null or empty:
if [[ -z $VMSS_IMG_PUBLIC_KEY ]] || [[ -z $VMSS_IMG_PRIVATE_KEY ]]
The above will not work for variables originating from a Keyvault task where the secret is an empty string. The variable value will be the variable name and this is not a nice way to check if its empty.
There you have it. If you ever find your key vault tasks variables not being mapped to ENV automatically or accessible directly, e.g., $(vmss-img-public-key), it could be that the secret is null or empty, which can occur when using Terraform or the https://github.com/aztfmod/terraform-azurerm-caf/blob/main/dynamic_secrets.tf module.
# When called from the CAF module it can only be used to set secret values
# For that reason, object must not be set.
# This is only used here for examples to run
# the normal recommendation for dynamic keyvault secrets is to call it from a landingzone
module "dynamic_keyvault_secrets" {
  source     = "./modules/security/dynamic_keyvault_secrets"
  depends_on = [module.keyvaults]
  for_each = {
    for keyvault_key, secrets in try(var.security.dynamic_keyvault_secrets, {}) : keyvault_key => {
      for key, value in secrets : key => value
      if try(value.value, null) != null && try(value.value, null) != ""
    }
  }

  settings = each.value
  keyvault = local.combined_objects_keyvaults[local.client_config.landingzone_key][each.key]
}

output "dynamic_keyvault_secrets" {
  value = module.dynamic_keyvault_secrets
}
Why not just deploy VMSS via Terraform and have this all in the logic, you ask? Well, that’s like expecting your pet cat to fetch your slippers – it’s just not possible! VMSS and Terraform are not supported if the Orchestration Mode is Uniform ( –orchestration-mode Uniform), so we have to make do with combining the worlds of AZ CLI and Terraform to dance together like an awkward couple. Think of it as a robot tango, with lots of beeps and boops!
In the ever-evolving landscape of cloud computing, the need for automation and governance at scale has never been more critical. Microsoft Azure, a leading cloud service provider, offers many features to manage and secure cloud resources effectively. However, the real game-changer in this domain is the Cloud Adoption Framework (CAF) Enterprise Scale Rover, a tool designed to supercharge your Azure governance strategy. This blog post will delve into automating the deployment of Azure Policy Definitions, Policy Sets (Initiatives), and Policy Assignments using CAF Enterprise Scale Rover, ensuring your Azure environment remains compliant, secure, and optimized.
Introduction to Azure Policies and CAF Rover
Azure Policies play a pivotal role in the governance framework of Azure environments. They enable organizations to define, assign, and manage policies that enforce rules over their resources, ensuring compliance with company standards and regulatory requirements. While Azure Policies are powerful, managing them across a large-scale environment can be daunting.
Enter CAF Enterprise Scale Rover, an innovative solution that streamlines the deployment and management of Azure Policies. It is designed to automate the process, making it easier, faster, and more efficient. By leveraging the CAF Rover, IT professionals can focus on strategic tasks, leaving the heavy lifting to the automation processes.
Setting Up Your Environment for CAF Rover
Before diving into the automation process, it’s essential to set up your environment to run the CAF Rover. This setup involves ensuring your development environment is ready, installing necessary tools like Docker, Terraform, Git, and configuring VSCode with specific extensions for Azure Policy and Docker support. Detailed guidance on setting up your environment can be found in the provided recommended reading, highlighting the importance of a properly configured dev environment for a seamless automation experience.
CAF Level Structure and eslz module for PoliciesPolicy Structure
You must plan out your Policy Definitions, then group them into Initiatives, and then assign initiatives to scopes (Management Groups or Subscriptions).
Automating Policy Definitions Deployment
The journey begins with automating Policy Definitions, the cornerstone of Azure Policy management. CAF Rover simplifies this process by leveraging a structured JSON format for defining policies, focusing on key areas such as allowed regions, naming conventions, and resource compliance checks. The process entails writing your Policy Definition in JSON, committing it to your Git repository, and deploying it to your Azure environment via CAF Rover commands. This approach ensures that all your cloud resources adhere to defined governance standards from the get-go.
Sample Policy Definition
{
  "name": "Append-AppService-httpsonly",
  "type": "Microsoft.Authorization/policyDefinitions",
  "apiVersion": "2021-06-01",
  "scope": null,
  "properties": {
    "policyType": "Custom",
    "mode": "All",
    "displayName": "AppService append enable https only setting to enforce https setting.",
    "description": "Appends the AppService sites object to ensure that  HTTPS only is enabled for  server/service authentication and protects data in transit from network layer eavesdropping attacks. Please note Append does not enforce compliance use then deny.",
    "metadata": {
      "version": "1.0.0",
      "category": "App Service",
      "source": "https://github.com/Azure/Enterprise-Scale/",
      "alzCloudEnvironments": [
        "AzureCloud",
        "AzureChinaCloud",
        "AzureUSGovernment"
      ]
    },
    "parameters": {
      "effect": {
        "type": "String",
        "defaultValue": "Append",
        "allowedValues": [
          "Audit",
          "Append",
          "Disabled"
        ],
        "metadata": {
          "displayName": "Effect",
          "description": "Enable or disable the execution of the policy"
        }
      }
    },
    "policyRule": {
      "if": {
        "allOf": [
          {
            "field": "type",
            "equals": "Microsoft.Web/sites"
          },
          {
            "field": "Microsoft.Web/sites/httpsOnly",
            "notequals": true
          }
        ]
      },
      "then": {
        "effect": "[parameters('effect')]",
        "details": [
          {
            "field": "Microsoft.Web/sites/httpsOnly",
            "value": true
          }
        ]
      }
    }
  }
}
Streamlining Policy Sets (Initiatives) Deployment
Next, we focus on Policy Sets, also known as Initiatives, which group multiple Policy Definitions for cohesive management. The CAF Rover enhances the deployment of Policy Sets by automating their creation and assignment. By grouping related policies, you can ensure comprehensive coverage of governance requirements, such as naming conventions and compliance checks, across your Azure resources. The automation process involves defining your Policy Sets in JSON format, committing them to your repository, and deploying them through CAF Rover, streamlining the governance of your cloud environment.
Sample Policy Set (Initiative)
{
  "name": "Audit-UnusedResourcesCostOptimization",
  "type": "Microsoft.Authorization/policySetDefinitions",
  "apiVersion": "2021-06-01",
  "scope": null,
  "properties": {
    "policyType": "Custom",
    "displayName": "Unused resources driving cost should be avoided",
    "description": "Optimize cost by detecting unused but chargeable resources. Leverage this Azure Policy Initiative as a cost control tool to reveal orphaned resources that are contributing cost.",
    "metadata": {
      "version": "2.0.0",
      "category": "Cost Optimization",
      "source": "https://github.com/Azure/Enterprise-Scale/",
      "alzCloudEnvironments": [
        "AzureCloud",
        "AzureChinaCloud",
        "AzureUSGovernment"
      ]
    },
    "parameters": {
      "effectDisks": {
        "type": "String",
        "metadata": {
          "displayName": "Disks Effect",
          "description": "Enable or disable the execution of the policy for Microsoft.Compute/disks"
        },
        "allowedValues": [
          "Audit",
          "Disabled"
        ],
        "defaultValue": "Audit"
      },
      "effectPublicIpAddresses": {
        "type": "String",
        "metadata": {
          "displayName": "PublicIpAddresses Effect",
          "description": "Enable or disable the execution of the policy for Microsoft.Network/publicIpAddresses"
        },
        "allowedValues": [
          "Audit",
          "Disabled"
        ],
        "defaultValue": "Audit"
      },
      "effectServerFarms": {
        "type": "String",
        "metadata": {
          "displayName": "ServerFarms Effect",
          "description": "Enable or disable the execution of the policy for Microsoft.Web/serverfarms"
        },
        "allowedValues": [
          "Audit",
          "Disabled"
        ],
        "defaultValue": "Audit"
      }
    },
    "policyDefinitions": [
      {
        "policyDefinitionReferenceId": "AuditDisksUnusedResourcesCostOptimization",
        "policyDefinitionId": "${current_scope_resource_id}/providers/Microsoft.Authorization/policyDefinitions/Audit-Disks-UnusedResourcesCostOptimization",
        "parameters": {
          "effect": {
            "value": "[parameters('effectDisks')]"
          }
        },
        "groupNames": []
      },
      {
        "policyDefinitionReferenceId": "AuditPublicIpAddressesUnusedResourcesCostOptimization",
        "policyDefinitionId": "${current_scope_resource_id}/providers/Microsoft.Authorization/policyDefinitions/Audit-PublicIpAddresses-UnusedResourcesCostOptimization",
        "parameters": {
          "effect": {
            "value": "[parameters('effectPublicIpAddresses')]"
          }
        },
        "groupNames": []
      },
      {
        "policyDefinitionReferenceId": "AuditServerFarmsUnusedResourcesCostOptimization",
        "policyDefinitionId": "${current_scope_resource_id}/providers/Microsoft.Authorization/policyDefinitions/Audit-ServerFarms-UnusedResourcesCostOptimization",
        "parameters": {
          "effect": {
            "value": "[parameters('effectServerFarms')]"
          }
        },
        "groupNames": []
      },
      {
        "policyDefinitionReferenceId": "AuditAzureHybridBenefitUnusedResourcesCostOptimization",
        "policyDefinitionId": "${current_scope_resource_id}/providers/Microsoft.Authorization/policyDefinitions/Audit-AzureHybridBenefit",
        "parameters": {
          "effect": {
            "value": "Audit"
          }
        },
        "groupNames": []
      }
    ],
    "policyDefinitionGroups": null
  }
}
Automating Policy Assignments
The final piece of the automation puzzle is Policy Assignments. This step activates the policies, applying them to your Azure resources. CAF Rover facilitates the automation of both custom and built-in Policy Assignments, ensuring your resources are governed according to the defined policies. Whether you are assigning custom initiatives or leveraging Azure’s built-in policies for zone resilience, the process is simplified through automation, allowing for efficient and effective governance at scale.
Sample Policy Assignment
{
  "type": "Microsoft.Authorization/policyAssignments",
  "apiVersion": "2022-06-01",
  "name": "as_baseline_security",
  "dependsOn": [],
  "properties": {
    "description": "This assignment includes EDG baseline security policies.",
    "displayName": "Custom baseline security",
    "policyDefinitionId": "${current_scope_resource_id}/providers/Microsoft.Authorization/policySetDefinitions/custom_baseline_security",
    "enforcementMode": null,
    "metadata": {
    },
    "nonComplianceMessages": [
      {
        "policyDefinitionReferenceId": "custom_audit_function_app_require_msi_tf_1",
        "message": "FUNC-001 - Use Azure-managed identity to securely authenticate to other cloud services/resources"
      },
      {
        "policyDefinitionReferenceId": "custom_deny_function_app_remotedebugging_tf_1",
        "message": "FUNC-014 - Turn off Remote debugging on your Function apps"
      },
      {
        "policyDefinitionReferenceId": "custom_deny_mismatched_res_resgroup_locations_tf_1",
        "message": "AZ-001 - Resource has been deployed in a different location from the resource group containing it"
      },
      {
        "policyDefinitionReferenceId": "custom_deny_non_allowed_resource_locations_tf_1",
        "message": "AZ-002 - Resource has been deployed in an unauthorised location"
      },
      {
        "policyDefinitionReferenceId": "custom_deny_storage_acc_accessible_over_http_tf_1",
        "message": "ST-013 - Enforce data encryption in transit by enabling HTTPS only"
      },
      {
        "policyDefinitionReferenceId": "custom_deny_storage_acc_disable_public_network_tf_1",
        "message": "ST-001 - Disable public network access"
      },
      {
        "policyDefinitionReferenceId": "custom_deploy_function_app_accessible_over_http_tf_1",
        "message": "FUNC-003 - Enforce data encryption in transit by enabling HTTPS only"
      },
      {
        "policyDefinitionReferenceId": "custom_deploy_function_app_require_ftps_only_tf_1",
        "message": "FUNC-009 - Disable FTP based deployment or configure to accept FTPS only"
      },
      {
        "policyDefinitionReferenceId": "custom_deploy_function_app_require_tls12_tf_1",
        "message": "FUNC-004 - Enforce minimum TLS version to 1.2"
      }
    ],
    "parameters": {
    },
    "scope": "${current_scope_resource_id}",
    "notScopes": []
  },
  "location": "${default_location}",
  "identity": {
    "type": "SystemAssigned"
  }
}
Archetypes
Archetypes are used in the Azure landing zone conceptual architecture to describe the Landing Zone configuration using a template-driven approach. The archetype is what fundamentally transforms Management Groups and Subscriptions into Landing Zones.
An archetype defines which Azure Policy and Access control (IAM) settings are needed to secure and configure the Landing Zones with everything needed for safe handover to the Landing Zone owner. This covers critical platform controls and configuration items, such as:
Consistent role-based access control (RBAC) settings
Guardrails for security settings
Guardrails for common workload configurations (e.g. SAP, AKS, WVD, etc.)
Automate provisioning of critical platform resources such as monitoring and networking solutions in each Landing Zone
This approach provides improved autonomy for application teams, whilst ensuring security policies and standards are enforced.
This tool greatly simplifies secure state management on Azure storage accounts. Additionally, it helps with testing different versions of binaries such as new versions of Terraform, Azure CLI, jq, tflint, etc. This tool also provides a ubiquitous development environment, which means everyone works with the same versions of the DevOps toolchain, always up-to-date, and runs on laptops, pipelines, GitHub Codespaces, and other platforms. It also facilitates the identity transition to any CI/CD, as all CI/CD have container capabilities. This tool allows for easy transition from one DevOps environment to another, including GitHub Actions, Azure DevOps, Jenkins, CircleCI, etc. Lastly, it’s an open-source tool and leverages open-source projects that are often needed with Terraform.
Helps testing different versions of binaries (new version of Terraform, Azure CLI, jq, tflint etc.)
Ubiquitous development environment: everyone works with the same versions of the DevOps toolchain, always up-to-date, running on laptop, pipelines, GitHub Codespaces, etc.
Facilitates the identity transition to any CI/CD: namely all CI/CD have container capabilities.
Allows easy transition from one DevOps environment to another (GitHub Actions, Azure DevOps, Jenkins, CircleCI etc.)
It’s open-source and leveraging open-source projects that you often need with Terraform.
Rover Completion – Return 0
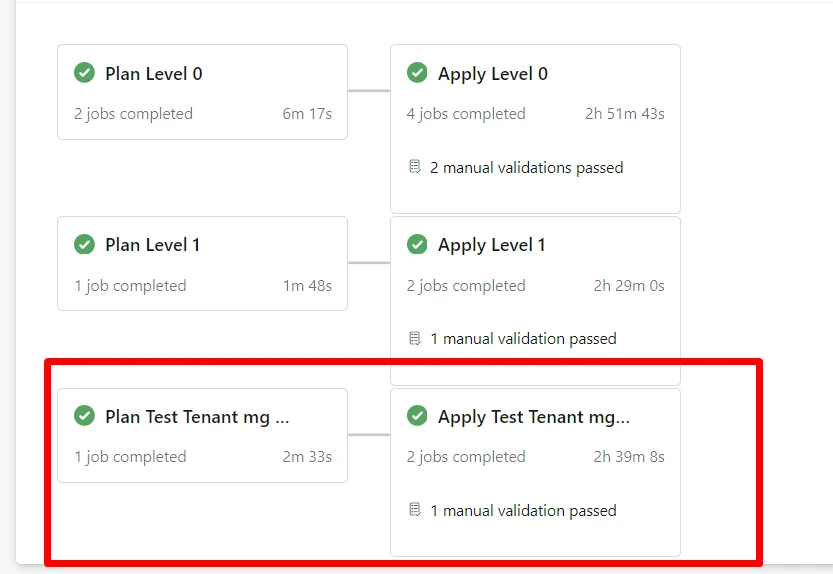
Integrating with Azure DevOps Pipelines
A critical aspect of automating Azure Policy deployment using CAF Enterprise Scale Rover is its seamless integration with Azure DevOps pipelines. This integration enables organizations to adopt a DevOps approach to cloud governance, where policy changes are version-controlled, reviewed, and deployed through automated CI/CD pipelines. By incorporating CAF Rover into Azure DevOps pipelines, you can ensure that policy deployments are consistent, repeatable, and auditable across different environments. This process not only enhances governance and compliance but also aligns with best practices for Infrastructure as Code (IaC), facilitating a collaborative and efficient workflow among development, operations, and security teams. Leveraging Azure DevOps pipelines with CAF Rover automation empowers organizations to maintain a high governance standard while embracing the agility and speed that cloud environments offer.
Azure DevOps Pipeline – CICD
Conclusion
Automating the deployment of Azure Policy Definitions, Policy Sets (Initiatives), and Policy Assignments using CAF Enterprise Scale Rover represents a significant leap forward in cloud governance. This approach not only saves time and reduces the potential for human error but also ensures a consistent and compliant Azure environment. By embracing automation with CAF Rover, organizations can achieve a robust governance framework that scales with their Azure deployments, securing their cloud journey’s success.
For those keen to automate their Azure Policies, diving into the CAF Rover’s capabilities is a must. The combination of detailed documentation, structured JSON for policy definitions, and automated deployment processes provides a clear path to efficient and effective Azure governance. Embrace the power of automation with CAF Enterprise Scale Rover and take your Azure governance to the next level.
Often you will be working out licensing costs and more often than not, you will need to know the number of vCores - as a baseline use the following script.
Get-AKSVCores.ps1
<#
.SYNOPSIS
Calculates total vCores for each Azure Kubernetes Service (AKS) cluster listed in a CSV file.
.DESCRIPTION
This script imports a CSV file containing AKS cluster information, iterates through each cluster, and calculates the total number of virtual cores (vCores) based on the node pools associated with each cluster. It requires Azure CLI and assumes that the user has the necessary permissions to access the AKS clusters and VM sizes.
.PARAMETER CsvFilePath
Full path to the CSV file containing AKS cluster information. The CSV file should have columns named 'ClusterName', 'Subscription', and 'ResourceGroup'.
.PARAMETER VmLocation
Azure region to get VM sizes for the calculation. Default is 'Australia East'.
.PARAMETER PerformAzureLogin
Indicates whether the script should perform Azure login. Set to $true if Azure login is required within the script; otherwise, $false. Default is $false.
# Iterate through each AKS cluster
foreach ($cluster in $aksClusters) {
# Set the current subscription
az account set --subscription $cluster.Subscription
# Logic to get the resource group
$resourceGroup = $cluster.ResourceGroup
# Get the node pools for the AKS cluster
$nodePools = az aks nodepool list --resource-group $resourceGroup --cluster-name $cluster.ClusterName --query "[].{name: name, count: count, vmSize: vmSize}" | ConvertFrom-Json
$totalVCores = 0
# Iterate through each node pool and calculate total vCores
foreach ($nodePool in $nodePools) {
# Get the VM size details
$vmSizeDetails = az vm list-sizes --location $VmLocation --query "[?name=='$($nodePool.vmSize)'].{numberOfCores: numberOfCores}" | ConvertFrom-Json
$vCores = $vmSizeDetails.numberOfCores
# Calculate total vCores for the node pool
$totalVCores += $vCores * $nodePool.count
}
# Output the total vCores for the cluster
Write-Host "$($cluster.ClusterName),$($cluster.Subscription),$($cluster.ResourceGroup),$totalVCores"
}
Hey there, savvy tech enthusiasts and cloud aficionados! If you’re anything like us, you’ve probably been keeping an eye on the economic tides as companies navigate the choppy waters of a recession. In times like these, every penny counts, and the IT world is no exception. With companies tightening their belts and trimming their workforces, it’s more important than ever to find creative ways to save big without sacrificing performance. Well, hold onto your keyboards, because we’ve got a cloud solution that’s about to make your wallets smile: Azure Spot Instances!
Azure Spot Instances: Catching the Cost-saving Wave
Picture this: azure skies, azure waters, and Azure Spot Instances—your ticket to slashing cloud costs like a pro. What are Azure Spot Instances, you ask? Well, they’re like the rockstar bargain of the cloud world, offering significant savings by leveraging unutilized Azure capacity. It’s like snagging a front-row seat at a concert for a fraction of the price, but instead of music, you’re rocking those cost-cutting beats.
So, here’s the scoop: Azure Spot Instances are like the cool kids in the virtual playground. They’re virtual machine scale sets that thrive on filling up the unused capacity gaps in the Azure cloud. Think of them as the ultimate budget-friendly roommates who crash on your couch when they’re not partying elsewhere. But wait, there’s a catch (of the best kind): they’re perfect for workloads that can handle a bit of a hiccup. We’re talking batch processing jobs, testing environments, and compute-intensive tasks that don’t mind a little dance with interruption.
Don’t Just Save, Make it Rain Savings
Now, imagine this scenario: you’ve got your AKS (Azure Kubernetes Service) cluster humming along, and you’re hosting your Dev and UAT environments. The spotlight is on your Spot Instances—they’re not the main act (that’s for staging and production), but they steal the show when it comes to saving money. So, let’s break it down.
With Azure Spot Instances, you’re not just pinching pennies; you’re saving big bucks. These instances are the economy class of the cloud world, with no high availability guarantees. If Azure needs space, the not-so-glamorous eviction notice might come knocking. But, hey, for Dev and UAT environments that can handle the occasional hiccup, it’s like getting bumped to first class on a budget.
Setting Sail with Spot Instances
Now that we’ve got your attention, let’s dive into the fun part—getting started! First things first, you need an AKS cluster that’s already playing nice with multiple node pools. And guess what? Your Spot Instance pool can’t be the default—it’s the star of the show, but it’s gotta know its role.
Using the Azure CLI, you’ll unleash the magic with a few commands. It’s like casting a spell, but way more practical. Picture yourself conjuring cost savings from thin air—pretty magical, right? Just create a node pool with the priority set to “Spot,” and voilà! You’re on your way to cloud cost-cutting greatness.
The Caveats, but Cooler
Now, before you go all-in on Spot Instances, remember, they’re not for every situation. These instances are the fearless daredevils of the cloud, ready to tackle evictions and interruptions head-on. But, just like you wouldn’t invite a lion to a tea party, don’t schedule critical workloads on Spot Instances. Set up taints and tolerations to ensure your instances dance only with the tasks that love a bit of unpredictability.
You can also leverage affinity roles to schedule your pod of dolphins on spot nodes with affinity labels.
Ready for the grand finale? Upgrading your Spot Instances is a breeze, and the best part is, AKS issues an eviction notice, not a complete storm-out. Plus, you can set a max price that works for you. Think of it like setting a budget for a shopping spree—except you’re not splurging on unnecessary costs.
So, there you have it, cloud trailblazers! Azure Spot Instances are the secret sauce to saving big during these recession times. With the right mindset, a sprinkle of taints, and a dash of tolerations, you’ll be riding the wave of cost-cutting success like a pro. Remember, it’s not just about saving money—it’s about making every cloud resource count. So go ahead, grab those Spot Instances by the horns and ride the cost-saving currents like the cloud-savvy superhero you were meant to be! 🚀🌩️
What usually happens is that you will initially install the chart and by default your kubernetes PV will have a default policy of DELETE. This means if you uninstall the chart, the Persistent Volume in the cloud (Azure, AWS, GCP etc) will also be deleted. Not a great outcome if you want historic metrics.
What you want is a PV that has a reclaim policy of retain, so that when the chart is every uninstalled, your managed disks in the cloud are retained.
So how do you go about doing this?
Install the chart initially with a persistent volume configured in the values files for Prometheus. (The default way)
Configure Grafana correctly on the first install.
Stage 1
Prometheus
We using managed GKE/GCP, so standard storage class is fine, your cloud provider may be different.
Configure your Prometheus Operator chart with the following in the values file.
Once the chart is deployed, go to your cloud provider and note the disk id’s. I am using GCP. So I note them down here:
In the above, the Name column is the disk id for GCP. Azure/AWS will be different e.g. Disk URI etc.
Go back to your helm chart repository and lets alter the chart so that Prometheus and Grafana are always bound to this disks, even if you uninstall the chart.
Prometheus
If you would like to keep the data of the current persistent volumes, it should be possible to attach existing volumes to new PVCs and PVs that are created using the conventions in the new chart. For example, in order to use an existing Azure disk for a helm release called `prometheus-operator` the following resources can be created:
Note down the RELEASE NAME of your prometheus operator chart. Mine is called prometheus operator.
Configure the following yaml template. This is a HACK. By making the name of the PV and PVC EXACTLY the same as the chart. Prometheus will reuse the PV/PVC.
With the above in place, you will be able to rerun chart installs for updates and uninstall the chart. Your final check is to ensure the PVs are RETAIN and not on the DELETE policy.
One of the key pillars regarding SRE is being able to make quantitative decisions based on key metrics.
The major challenge is what are key metrics and this is testament to the plethora of monitoring software out in the wild today.
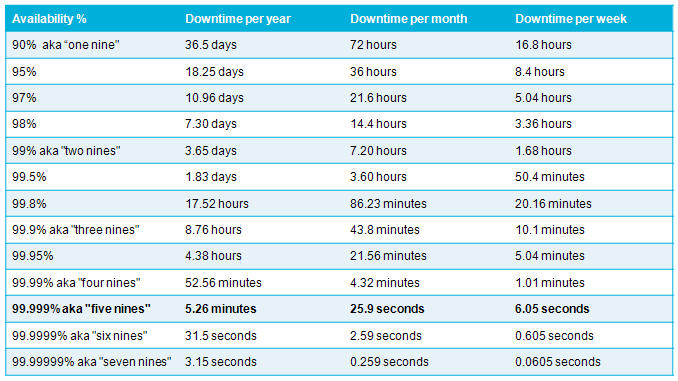
At a foundational level you want to ensure your services are always running, however 100% availability in not practical.
Class SRE implements Devops
{
  MeasureEverything()
}
Availability/Error Budget
You then figure out what availability is practical for your application and services.
Availability
Your error budget will then be the downtime figure e.g. 99% is 7.2 hours of downtime a month that you can afford to have.
SLAs, SLOs and SLIs
This will be the starting point on your journey to implementing quantitative analysis to
Service Level Agreements
Service Level Objectives
Service Level Indicators
This blog post is all about how you can measure Service Level Objectives without breaking the bank. You do not need to spend millions of dollars on bloated monitoring solutions to observe key metrics that really impact your customers.
Just like baking a cake, these are the ingredients we will use to implement an agile, scaleable monitoring platform that is solely dedicated to doing one thing well.
Outcome
This is what we want our cake to deliver:
Measuring your SLA Compliance Level
Measuring your Error Budget Burn Rate
Measuring if you have exhausted your error budget
Service Level Compliance – SLAs -> SLOs -> SLIs
If you look at the cake above, you can see all your meaningful information in one dashboard.
Around 11am the error budget burn rate went up. (A kin to your kids spending all their pocket money in one day!)
Compliance was breached (99% availability) – The purple line (burn rate) went above the maximum budget (yellow line)
These are metrics you will want to ALERT on at any time of the day. These sort of metrics matter. They are violating a Service Level Agreement.
What about my other metrics?
Aaaah, like %Disk Queue Length, Processor Time, Kubernetes Nodes/Pods/Pools etc? Well…
I treat these metrics as second class citizens. Like a layered onion. Your initial metrics should be – Am I violating my SLA? If not, then you can use the other metrics that we have enjoyed over the decades to compliment your observeability into the systems and as a visual aid for diagnostics and troubleshooting.
Alerting
Another important consideration is the evolution of infrastructure. In 1999 you will have wanted to receive an alert if a server ran out of disk space. In 2020, you are running container orchestration clusters and other high availability systems. A container running out of disk space is not so critical as it used to be in 1999.
Evaluate every single alert you have and ask yourself. Do I really need to wake someone up at 3am for this problem?
Always alert on Service Level Compliance levels ABOUT to breach
Always alert on Error Budget Burn Rates going up sharply
Do not alert someone out of hours because the CPU is 100% for 5 minutes unless Service Level Compliance is being affected to
You will have happier engineers and a more productive team. You will be cooled headed during an incident because you know the different between a cluster node going down versus Service Level Compliance violations. Always solve the Service Level Compliance and then fix the other problems.
Ingredients
Where are the ingredients you promised? You said it will not break the bank, I am intrigued.
A Kubernetes cluster – Google, Azure Kubernetes Services etc
ArgoCD – Argo CD is a declarative, GitOps continuous delivery tool for Kubernetes.
In this post we have touched on the FOUNDATION of what we want out of monitoring.
We know exactly what we want to measure – Service Level Compliance, Error Budget Burn Rate and Max Budget. All this revolves around deciding on the level of availability we give a service.
We touched on the basic ingredients that we can use to build this solution.
In my next blog post we will discuss how we mix all these ingredients together to provide a platform that is is good at doing one thing well.
Measuring Service Level Compliance & Error Budget Burn Rates
When you give your child $30 to spend a month and they need to save $10 a month. You need to be alerted if they spending too fast (Burn Rate).
Often you may require a unique custom build/release agent with a specific set of tools.
A good example is a dynamic Ansible Agent that can manage post deployment configuration. This ensures configuration drift is minimised.
Secondly this part of a release is not too critical, so we can afford to spend a bit of time downloading a docker image if it is not already cached.
This article demonstates how you can dynamically spawn a docker container during your release pipeline to apply configuration leveraging Ansible. It will also demonstrate how to use Ansible Dynamic Inventory to detect Azure Virtual machine scale set instances – in the past you would run hacks on facter.
Prerequsites
You will require:
A docker image with ansible – You can use mine as a starting point – https://github.com/Romiko/DockerUbuntuDev The above is hosted at: dockerhub – romiko/ansible:latest (See reference at bottom of this page)
A Self-host Azure Devops Agent – Linux
Docker installed on the self-hosted agent
Docker configured to expose Docker Socket docker run -v /var/run/docker.sock:/var/run/docker.sock -d –name some_container some_image
In the above the code that is causing a SIBLING container to spawn on the self-hosted devops agent is:
docker run –rm -v $(System.DefaultWorkingDirectory)/myproject/config:/playbooks/ romiko/ansible:latest \ <command to execute inside the container>
Here we have a mount point occuring where the config folder in the repo will be mounted into the docker container.
-v <SourceFolder>:<MountPointInDockerContainer>
The rest of the code after the \ will execute on the docker container. So in the above,
The container will become a sibling,
Entry into a bash shell
Container will mount a /playbooks folder containing the source code from the build artifacts
Connect to azure
Run an anisble playbook.
The playbook will find all virtual machine scale sets in a resoruce group with a name pattern
Apply a configuration by configuring logstash to auto reload config files when they change
Apply a configuration by copying files
Ansible
The above is used to deploy configurations to an Azure Virtual Machine Scale Set. Ansible has a feature called dynamica inventory. We will leverage this feature to detect all active nodes/instances in a VMSS.
The structure of ansible is as follows:
Ansible Dynamic Inventory
So lets see how ansible can be used to detect all running instances in an Azure Virtual machine Scale Set
inventory_dev_azure_rm.yml
Below it will detect any VMSS cluster in resourcegroup rom-dev-elk-stack that has logstash in the name
plugin: azure_rm

include_vmss_resource_groups:
- rom-dev-elk-stack

conditional_groups:
  logstash_hosts: "'logstash' in name"

auth_source: auto
logstash_hosts.yml (Ensure this lives in a group_vars folder)
Now, I can configure ssh using a username or ssh keys.
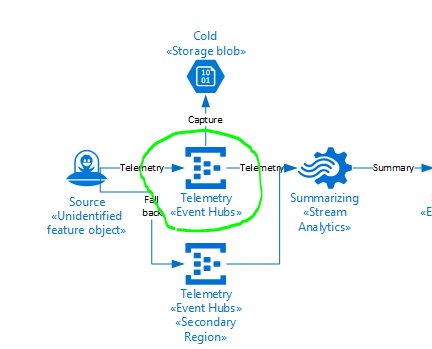
When you are dealing with millions of events per day (Json format). You need a debugging tool to deal with events that do no behave as expected.
Recently we had an issue where an Azure Streaming analytics job was in a degraded state. A colleague eventually found the issue to be the output of the Azure Streaming Analytics Job.
The error message was very misleading.
[11:36:35] Source 'EventHub' had 76 occurrences of kind 'InputDeserializerError.TypeConversionError' between processing times '2020-03-24T00:31:36.1109029Z' and '2020-03-24T00:36:35.9676583Z'. Could not deserialize the input event(s) from resource 'Partition: [11], Offset: [86672449297304], SequenceNumber: [137530194]' as Json. Some possible reasons: 1) Malformed events 2) Input source configured with incorrect serialization format\r\n"
The source of the issue was CosmosDB, we need to increase the RU’s. However the error seemed to indicate a serialization issue.
We developed a tool that could subscribe to events at exactly the same time of the error, using the sequence number and partition.
We also wanted to be able to use the tool for a large number of events +- 1 Million per hour.
Please click link to the EventHub .Net client. This tool is optimised to use as little memory as possible and leverage asynchronous file writes for the an optimal event subscription experience (Console app of course).
Have purposely avoided the newton soft library for the final file write to improve the performance.
The output will be a json array of events.
The next time you need to be able to subscribe to event hubs to diagnose an issue with a particular event, I would recommend using this tool to get the events you are interested in analysing.


You must be logged in to post a comment.