Using AI to detect anomalies in my gas bills

Hey,

I sometimes get a crazy gas bill come through. So I decided to generate some raw data for my gas bill and feed it into the Azure Anomaly Detector API.

Prerequisites:

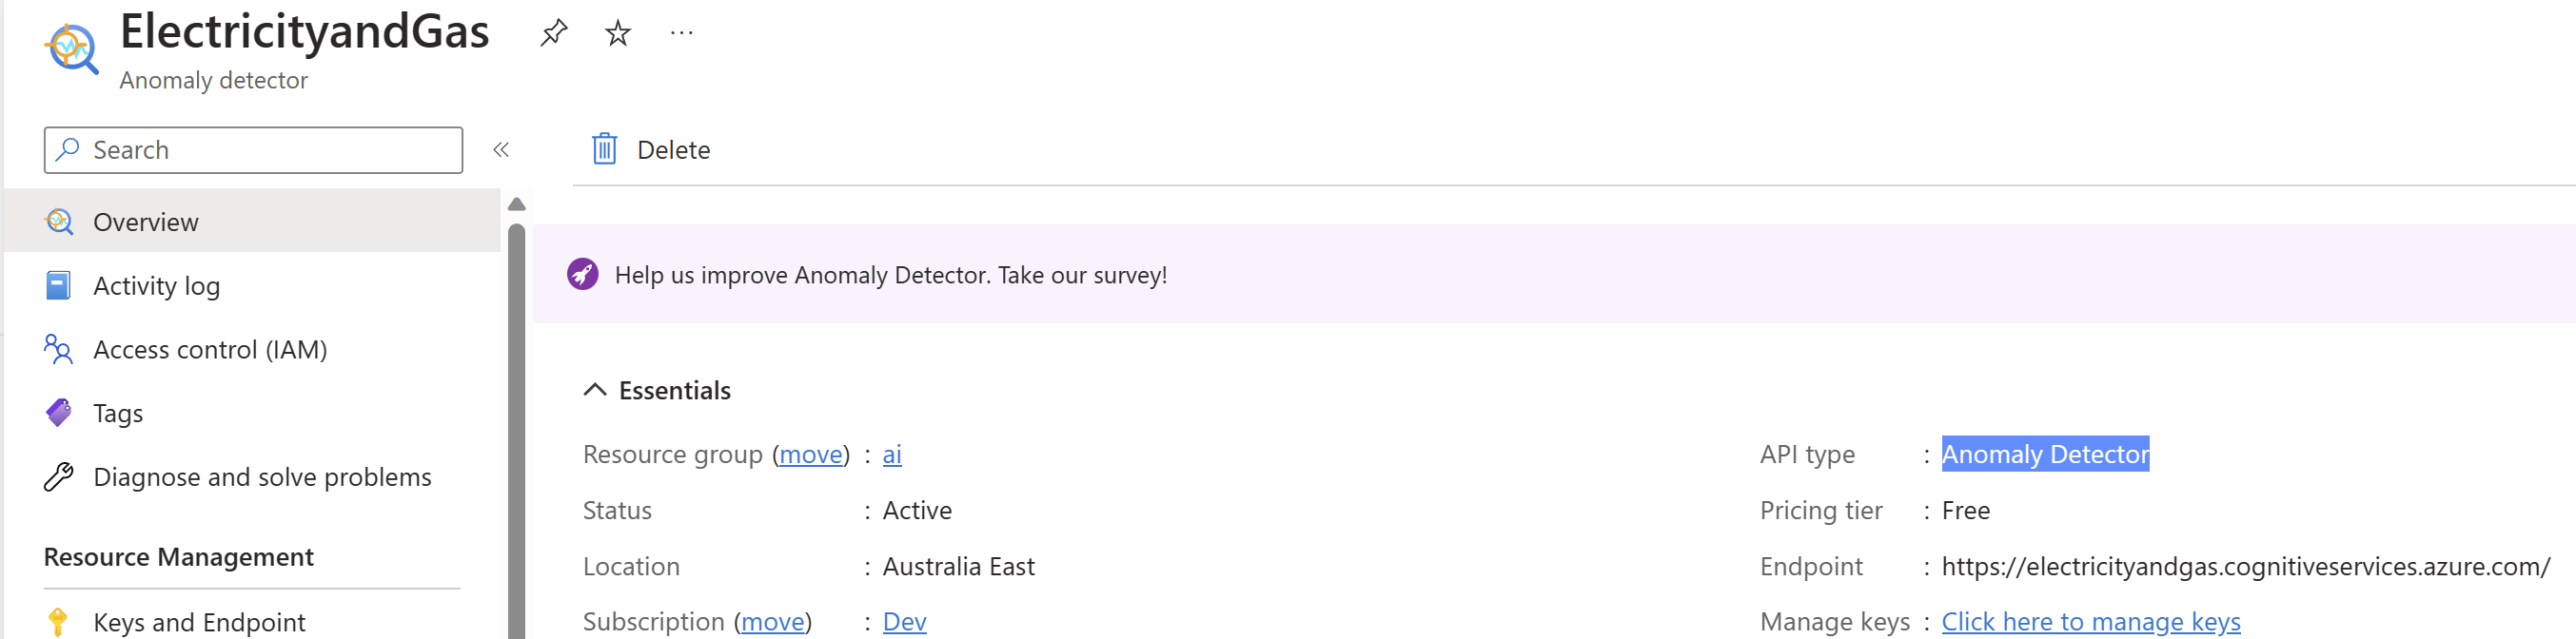
With our new found Azure service up and running, lets get down and dirty.

Then I massaged by gas bill data into this format, so we have nice timestamps (ISO 8601) and double-precision floating-point numbers.

2021-08-01T00:00:00Z,46.49
2021-09-01T00:00:00Z,78.33
2021-10-01T00:00:00Z,80.39
2021-11-01T00:00:00Z,40.63
2021-12-01T00:00:00Z,154.76
2022-01-01T00:00:00Z,39.60
2022-02-01T00:00:00Z,37.19
2022-03-01T00:00:00Z,78.72
2022-04-01T00:00:00Z,20.98
2022-05-01T00:00:00Z,23.02
2022-06-01T00:00:00Z,107.82
2022-07-01T00:00:00Z,60.60
2022-08-01T00:00:00Z,54.96
2022-09-01T00:00:00Z,86.11
2022-10-01T00:00:00Z,81.61
2022-11-01T00:00:00Z,42.35
2022-12-01T00:00:00Z,55.36
2023-01-01T00:00:00Z,47.92
2023-02-01T00:00:00Z,48.05
2023-03-01T00:00:00Z,119.25
2023-04-01T00:00:00Z,61.10
2023-05-01T00:00:00Z,23.64
2023-06-01T00:00:00Z,151.32
2023-07-01T00:00:00Z,92.94

Finally, I created a jupyter notebook and fed the data into it, calling the api

from azure.ai.anomalydetector import AnomalyDetectorClient
from azure.ai.anomalydetector.models import *
from azure.core.credentials import AzureKeyCredential
import pandas as pd
import os

API_KEY = os.environ['ANOMALY_DETECTOR_API_KEY']
ENDPOINT = os.environ['ANOMALY_DETECTOR_ENDPOINT']
DATA_PATH = "d:\\ai\\energy-data.csv"

client = AnomalyDetectorClient(ENDPOINT, AzureKeyCredential(API_KEY))

series = []
data_file = pd.read_csv(DATA_PATH, header=None, encoding='utf-8', date_parser=[0])
for index, row in data_file.iterrows():
    series.append(TimeSeriesPoint(timestamp=row[0], value=row[1]))

request = UnivariateDetectionOptions(series=series, granularity=TimeGranularity.DAILY)

change_point_response = client.detect_univariate_change_point(request)
anomaly_response = client.detect_univariate_entire_series(request)

for i in range(len(data_file.values)):
    if (change_point_response.is_change_point[i]):
        print("Change point detected at index: "+ str(i))
    elif (anomaly_response.is_anomaly[i]):
        print("Anomaly detected at index:      "+ str(i))

It was great to see the AI system pickup the culprits!

  • A massive party in December 2001
  • A stove left on for a few days in June 2023 or maybe the gas company starting to charge us higher rates than they should?

Happy code with AI, it is super fun once you get creative with it!

🙂

Kubernetes – Menu Command line – Common Tasks

Please find one of my favourite menu driven scripts that I use with developers if they keen to use the command line vs tools like Rancher to get to know Kubernetes e.g. Scaling Services, View Nginx Log files for suspicious activity etc

#!/bin/bash

# Function to display menu
display_menu() {
    clear
    echo "=== Kubernetes Administrator Menu ==="
    echo "1. Get Pods"
    echo "2. Get Services"
    echo "3. Describe Pod"
    echo "4. Describe Service"
    echo "5. View Log Files"
    echo "6. View High-Count Ingress HTTP Requests"
    echo "7. Scale Up Deployment"
    echo "8. Scale Down Deployment"
    echo "9. Exit"
    echo
    read -p "Enter your choice: " choice
    echo
}

# Function to get pods
get_pods() {
    kubectl get pods
    echo
    read -p "Press enter to continue..."
}

# Function to get services
get_services() {
    kubectl get services
    echo
    read -p "Press enter to continue..."
}

# Function to describe a pod
describe_pod() {
    read -p "Enter the pod name: " pod_name
    kubectl describe pod $pod_name
    echo
    read -p "Press enter to continue..."
}

# Function to describe a service
describe_service() {
    read -p "Enter the service name: " service_name
    kubectl describe service $service_name
    echo
    read -p "Press enter to continue..."
}

# Function to view log files
view_logs() {
    read -p "Enter the pod name: " pod_name
    read -p "Enter the container name (press enter for all containers): " container_name

    if [ -z "$container_name" ]; then
        kubectl logs $pod_name
    else
        kubectl logs $pod_name -c $container_name
    fi

    echo
    read -p "Press enter to continue..."
}

# Function to view high-count ingress HTTP requests
view_high_count_requests() {
    read -p "Enter the log file name: " log_file
    read -p "Enter the high count threshold: " threshold

    awk -v threshold=$threshold '/ingress/ { count[$NF]++ } END { for (ip in count) { if (count[ip] > threshold) print count[ip], ip } }' $log_file

    echo
    read -p "Press enter to continue..."
}

# Function to scale up a deployment
scale_up_deployment() {
    read -p "Enter the deployment name: " deployment_name
    read -p "Enter the number of replicas to scale up: " replicas

    kubectl scale deployment $deployment_name --replicas=+$replicas
    echo "Deployment scaled up successfully!"
    echo
    read -p "Press enter to continue..."
}

# Function to scale down a deployment
scale_down_deployment() {
    read -p "Enter the deployment name: " deployment_name
    read -p "Enter the number of replicas to scale down: " replicas

    kubectl scale deployment $deployment_name --replicas=-$replicas
    echo "Deployment scaled down successfully!"
    echo
    read -p "Press enter to continue..."
}

# Main script
while true; do
    display_menu

    case $choice in
        1) get_pods;;
        2) get_services;;
        3) describe_pod;;
        4) describe_service;;
        5) view_logs;;
        6) view_high_count_requests;;
        7) scale_up_deployment;;
        8) scale_down_deployment;;
        9) exit;;
        *) echo "Invalid choice. Please try again.";;
    esac
done

Unleashing the Power of Azure CAF Super Module: Exploring the CAF Enterprise Module and its Advantages and Disadvantages

Introduction

As organizations increasingly adopt cloud computing, they require a robust framework to guide their cloud journey effectively. Microsoft Azure offers the Cloud Adoption Framework (CAF), a proven methodology to accelerate cloud adoption and provide organizations with a structured approach. Building upon the CAF, Microsoft has introduced the Azure CAF Super Module, enhancing the framework’s capabilities. In this blog post, we will delve into the CAF Super Module, with a particular focus on the CAF Enterprise Module, and discuss the advantages and disadvantages of leveraging this powerful tool.

Understanding the Azure CAF Super Module

“We want to promote “infrastructure-as-data” in favor of ad-hoc “infrastructure-as-code”, in order to make composition more accessible and rely on a strong community to write code.”

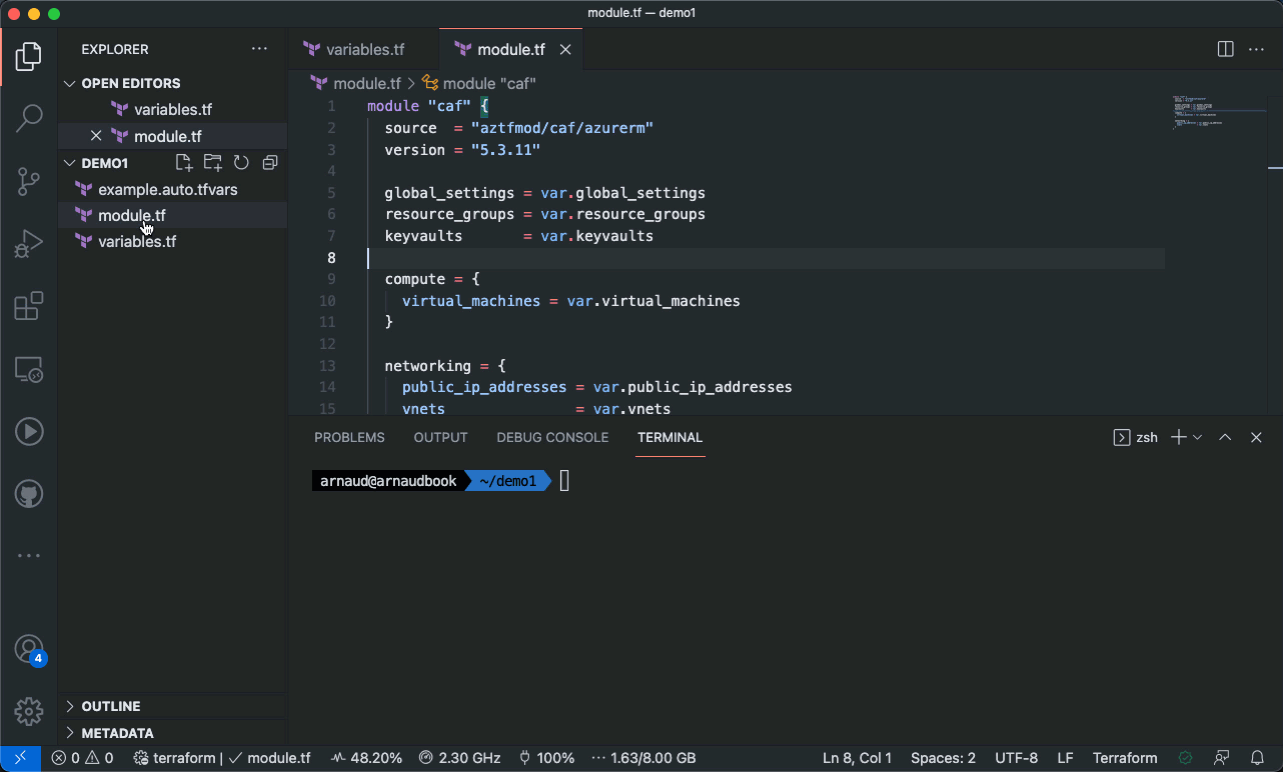
The Azure CAF Super Module is an extension of the Cloud Adoption Framework, tailored specifically for Azure. It serves as a comprehensive guide to help organizations develop their cloud strategy, plan migrations, establish governance controls, and optimize their cloud environments. By adopting the Super Module, organizations can align their cloud initiatives with Azure best practices, ensuring a secure, scalable, and efficient cloud adoption journey.

The CAF Enterprise Module

At the core of the Azure CAF Super Module lies the CAF Enterprise Module, a key component designed to provide organizations with a standardized approach to building and operating their cloud environments. The CAF Enterprise Module encompasses several crucial elements, including governance, operations, and security, enabling organizations to effectively manage and maintain their Azure deployments.

  1. Governance: The CAF Enterprise Module offers a set of governance principles, guidelines, and best practices that facilitate the implementation of effective governance controls. It helps organizations define roles and responsibilities, establish policies, and ensure compliance and security in their Azure environments. The module assists in creating a well-structured governance framework, enabling organizations to balance control and agility.
  2. Operations: With the CAF Enterprise Module, organizations can implement standardized operational practices for managing their Azure environments. It provides guidance on monitoring, management, and incident response, helping organizations ensure the reliability, availability, and performance of their cloud resources. The module also assists in automating operational tasks, optimizing costs, and maintaining service continuity.
  3. Security: Security is a critical aspect of any cloud deployment, and the CAF Enterprise Module emphasizes this by offering comprehensive security guidance. It provides organizations with a structured approach to defining security policies, implementing security controls, and managing identity and access. The module also focuses on threat protection, data protection, and compliance, enabling organizations to build secure and compliant Azure environments.

Advantages of the CAF Super Module

  1. Standardization: The Azure CAF Super Module promotes standardization by providing a well-defined framework for cloud adoption. It ensures that organizations follow best practices and establish consistent processes and policies, resulting in improved efficiency and reduced complexity.
  2. Accelerated adoption: The CAF Super Module accelerates cloud adoption by offering a clear roadmap and guidance. It helps organizations avoid common pitfalls and make informed decisions throughout their cloud journey, ultimately saving time and effort.
  3. Enhanced governance: The CAF Enterprise Module enhances governance capabilities by providing a structured approach to establish and enforce governance controls. It ensures compliance, mitigates risks, and promotes accountability, giving organizations greater control over their Azure environments.
  4. Improved security and compliance: With the CAF Super Module, organizations can strengthen their security posture and achieve compliance objectives. The module offers comprehensive security guidance, enabling organizations to implement robust security controls and protect their data and resources effectively.

Disadvantages of the CAF Super Module

  1. Complexity: While the CAF Super Module offers a comprehensive framework, its implementation can be complex for organizations with limited cloud expertise. Organizations may need to invest in training and additional resources to fully leverage the capabilities of the Super Module.
  2. Customization challenges: The CAF Super Module provides a standardized
  3. approach, which may not align perfectly with every organization’s unique requirements. Adapting the Super Module to specific needs may involve additional customization efforts and careful consideration of individual business objectives.
  4. Remediation of legacy assets is not really accounted for and probably requires a seprate git repo for retro fixing due to legacy resources not having a naming convention to begin with

Conclusion

The Azure CAF Super Module, with its powerful CAF Enterprise Module, provides organizations with a robust framework for accelerating their cloud adoption journey on the Azure platform. By leveraging the CAF Super Module, organizations can benefit from standardized practices, enhanced governance, improved security, and accelerated cloud adoption. However, it is essential to acknowledge the potential complexities and customization challenges that organizations may encounter while implementing the Super Module. Overall, the Azure CAF Super Module offers a valuable toolset for organizations seeking to maximize the benefits of Azure and achieve successful cloud transformations.

Sources:

https://aztfmod.github.io/documentation/docs/module/module-intro/

https://github.com/aztfmod/terraform-azurerm-caf

Securing Kubernetes with Calico Cloud

In the ever-evolving world of technology, securing Kubernetes clusters has become a paramount concern for organizations. With the rise of cloud-native applications and microservices architectures, the need for a robust security solution has become more crucial than ever. This is where Calico Cloud from Tigera shines as an exceptional tool to enhance the security posture of a Kubernetes cluster.

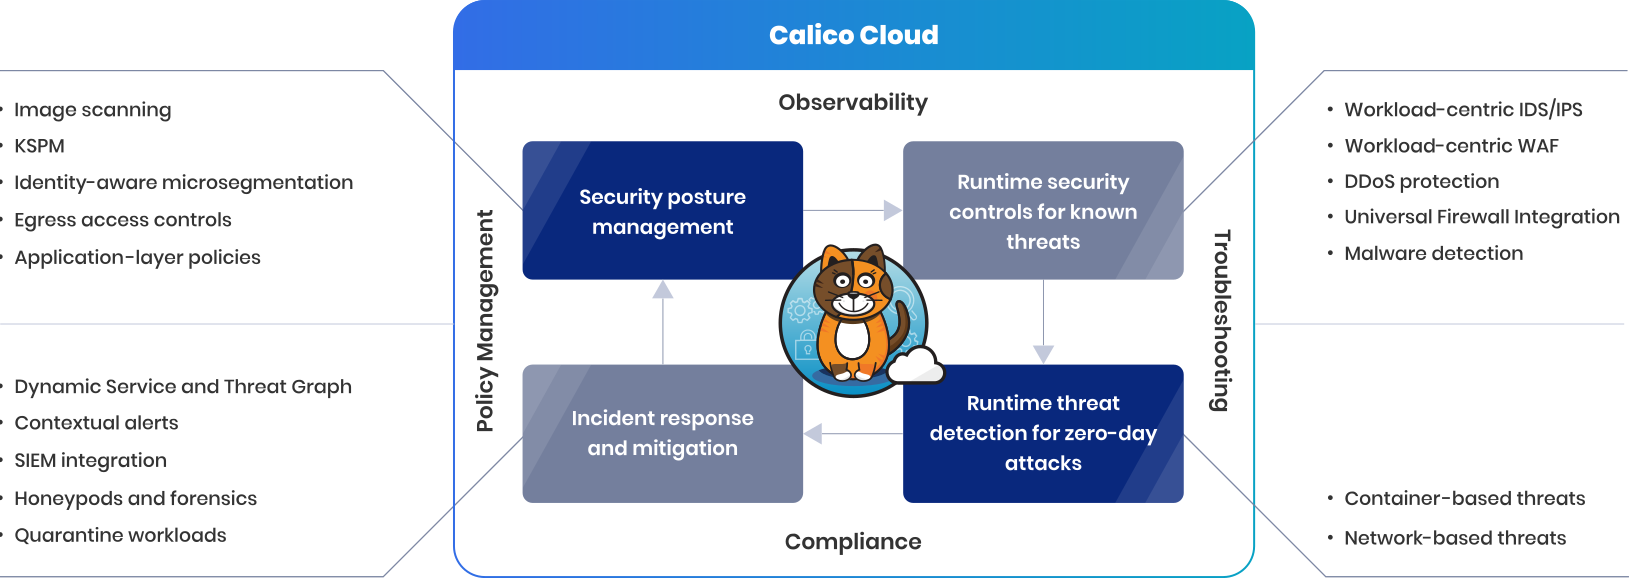
Calico Cloud offers a comprehensive set of features and capabilities specifically designed to address the unique security challenges of Kubernetes environments. By leveraging its advanced networking and security capabilities, Calico Cloud empowers organizations to protect their clusters against various threats, enforce granular security policies, and gain deep visibility into their network traffic.

Course vs. Fine-Grain Policies:

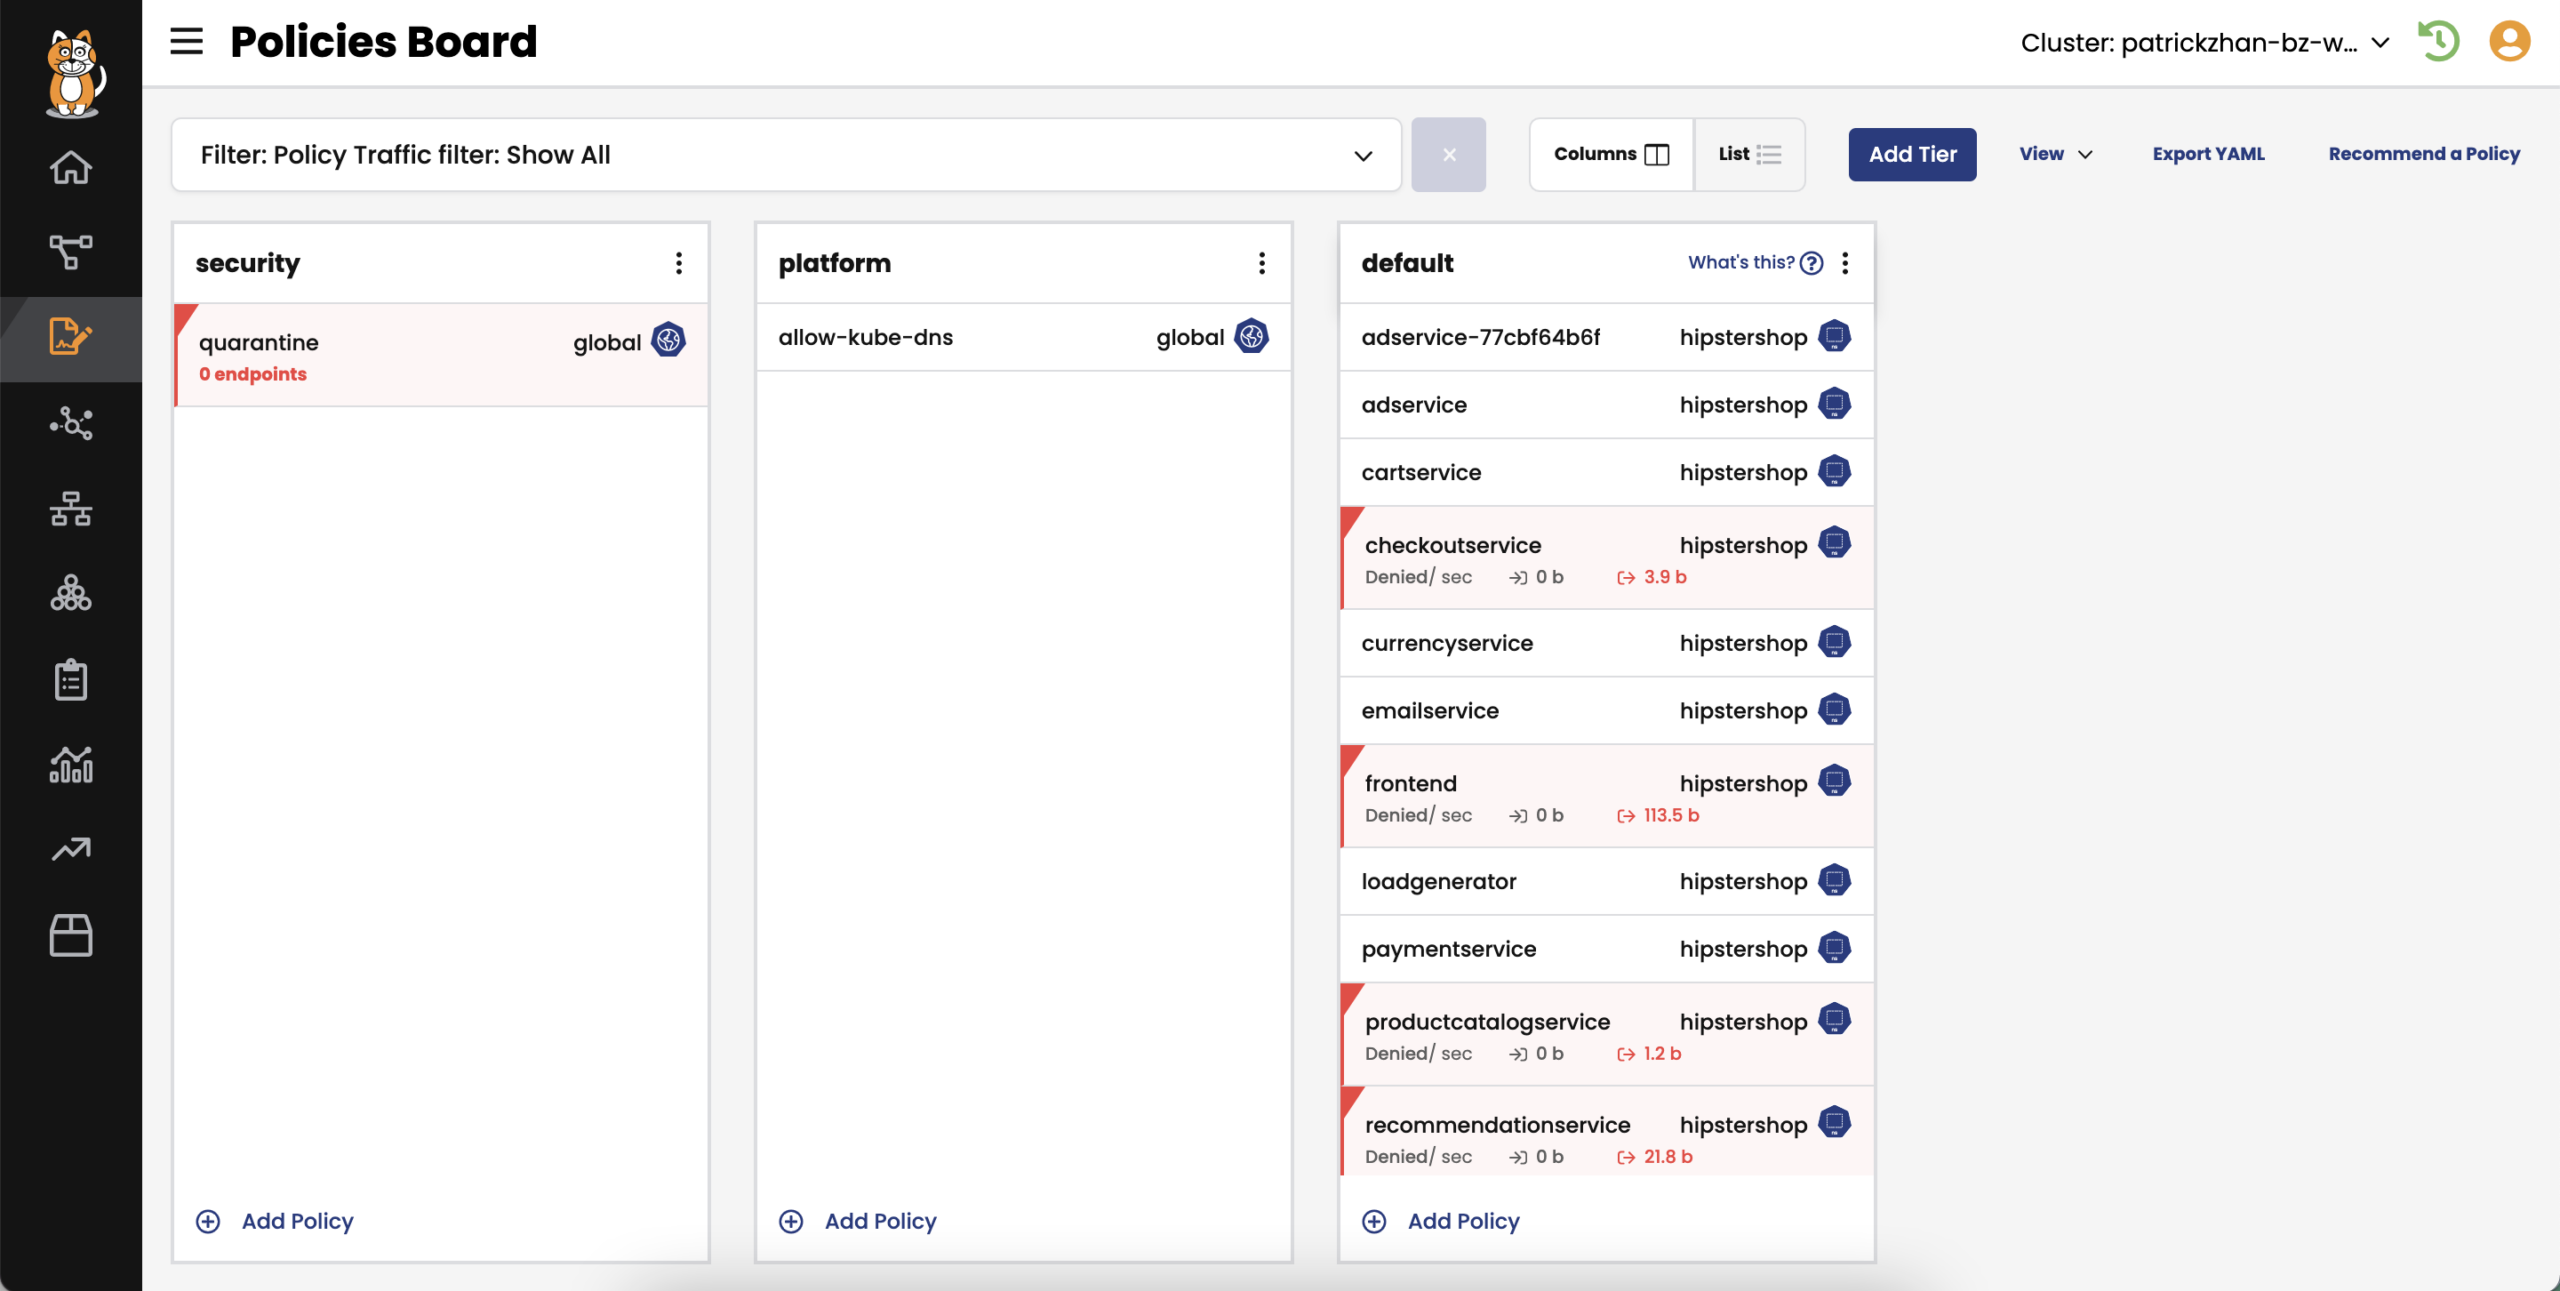
One of the key aspects that make Calico Cloud an excellent choice for improving the security posture of a Kubernetes cluster is its ability to enforce both course and fine-grain security policies. These policies act as guardrails to ensure that only authorized traffic flows within the cluster, mitigating the risks of unauthorized access, data breaches, and lateral movement by malicious actors.

Course-grain policies enable administrators to define high-level security rules that apply to entire namespaces or the entire cluster. These policies help establish a strong foundation for security by setting broad guidelines such as allowing or denying traffic between namespaces, restricting external access to certain services, or implementing network segmentation. Course-grain policies are easy to define and manage, making them suitable for organizations looking for initial security controls.

On the other hand, fine-grain policies offer a more granular level of control over network traffic within the Kubernetes cluster. These policies allow administrators to define rules based on specific labels, namespaces, IP addresses, or other metadata associated with pods and services. With fine-grain policies, organizations can precisely control which pods can communicate with each other, what protocols and ports are allowed, and even enforce encryption requirements. Fine-grain policies provide a high level of flexibility and customization, enabling organizations to tailor their security controls according to their specific requirements.

By offering both course and fine-grain policies, Calico Cloud allows organizations to strike a balance between simplicity and flexibility in securing their Kubernetes clusters. It provides a unified platform to manage and enforce these policies, simplifying the overall security management process.

Zero-trust Workload Security

Implement zero-trust workload access controls for traffic to and from individual pods to external endpoints on a per-pod basis to protect your Kubernetes cluster. Author DNS policies that implement fine-grained access controls between a workload and the external services it needs to connect to, like Amazon RDS, ElasticCache, and more.

Limit the blast radius when a security breach results in an APT (advanced persistent threat) with identity-aware microsegmentation for both container and VM workloads. Use a single policy framework and Kubernetes declarative model to set controls at the host, container/VM, and application levels.

Extend the use of existing firewalls and SIEMs to your Kubernetes environment with out-of-the-box firewall and SIEM integrations.

KEY FEATURES INCLUDE

  • Zero-trust workload access controls
  • Identity-aware microsegmentation for workloads
  • Firewall and SIEM integration
  • Envoy-based application-level protection

Conclusion:

In conclusion, Calico Cloud from Tigera is an outstanding tool for enhancing the security posture of Kubernetes clusters. Its advanced networking and security capabilities, coupled with the ability to enforce course and fine-grain policies, make it a comprehensive solution to protect against threats and enforce robust security controls. With Calico Cloud, organizations can achieve a higher level of confidence in the security of their Kubernetes deployments, ensuring the integrity, confidentiality, and availability of their applications and data.

Calico Cloud has proven instrumental in protecting our kubernetes cluster infrastructure at scale. Allowing us to control both North-South and East-West traffic.

Most secure way to access Azure Cloud

What if I told you that you could access your Azure Cloud Resources and tick the following boxes:

  • More secure than a VPN
  • More secure than a Bastion Host and Jumpbox
  • No need for patching and SOC2 compliance reports

If your cloud environment is serverless, why settle for less when it comes to remote access?

As soon as you introduce a jump box, you are required to patch the damn thing and this eats into the Opex budget in a big way.

So what is the solution?

What if you had a docker image with all the tools you need for support that you can spin up into an Azure Container Instance and access on demand, with the filesystem running off Azure Blob Storage?

Well, this is possible, and the good news is that you do not need to build it yourself. Microsoft already offers it.

Welcome to Azure Cloud Shell with VNET Integration!

Cloud Shell with VNET integration leveraging subnet delegation for ACI

The only limitation is that the Storage Account only supports Primary Regions, however Microsoft notified me today that Australia East is now supported.

Microsoft is currently working on more secondary region support, just something to be aware of from a security/data sovereignty perspective.

So the experience is like this.

  1. Log into the Azure Portal
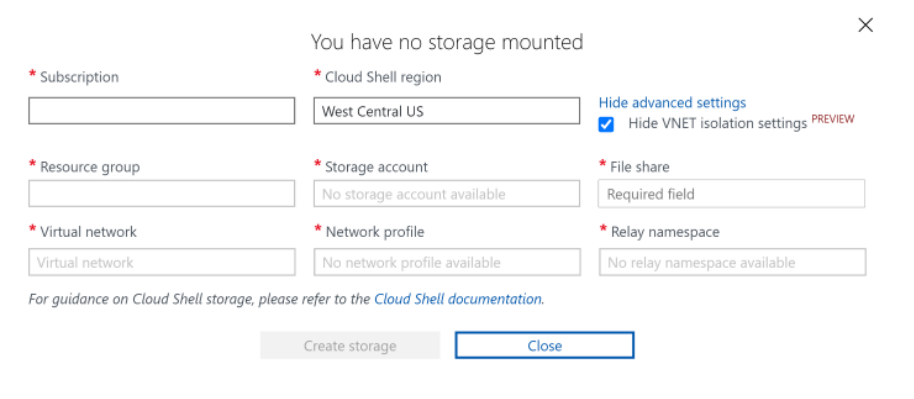
  2. Choose Cloud Shell with advanced options – Select VNET Integration and select the subnet / storage account that we will terraform
  3. Boom – You are in the Azure network and Cloud Shell will have all your common support tools that your require.

Terraform

We will need:

  • Dedicated subnet for CloudShell ACI instances to spin up in.

"csh" = "10.1.12.0/26"

  • Dedicated support subnet for storage account

"sup" = "10.1.13.0/26"

  • A dedicate subnet for the Azure Relay
relay_subnet = "10.1.14.0/26"

# Container instance built in OID for permissions / delegation
# Manually grant in Azure AD
container_instance_oid = "4c1b7058-e8ea-4854-abd2-bbb0abb6cd24"
  • Storage Account for OS filesystem – network rules for Cloudshell
# See https://github.com/Azure/azure-quickstart-templates/blob/master/demos/cloud-shell-vnet-storage/azuredeploy.json
resource "azurerm_storage_account" "cloud_shell" {
  name                         = "st${var.client}${var.env}${var.location_shortname}sup"
  resource_group_name          = azurerm_resource_group.rg.name
  location                     = azurerm_resource_group.rg.location
  allow_blob_public_access     = false
  account_tier                 = "Standard"
  access_tier                  = "Cool"
  account_replication_type     = "LRS"
  tags                         = local.tags
  enable_https_traffic_only    = true
  network_rules {
    bypass                     = ["None"]
    default_action             = "Deny"
    ip_rules                   = [ "101.112.8.233" ]
    virtual_network_subnet_ids = [
      azurerm_subnet.cloud_shell_subnet.id,
      azurerm_subnet.subnet["sup"].id
      ]
  }
}

resource "azurerm_storage_share" "cloud_shell" {
  name                 = "cshsupport"
  storage_account_name = azurerm_storage_account.cloud_shell.name
  quota                = 50
}
  • Then a Cloudshell Subnet leveraging subnet delegation so ACI can control network devices
resource "azurerm_subnet" "cloud_shell_subnet" {
  name                 = "snet-${local.resource_id}-${var.client}-csh"
  resource_group_name  = azurerm_resource_group.rg.name
  virtual_network_name = azurerm_virtual_network.network.name
  address_prefixes     = [var.cloud_shell_subnet]

  delegation {
    name = "delegation"

    service_delegation {
      name    = "Microsoft.ContainerInstance/containerGroups"
    }
  }
  service_endpoints = [
    "Microsoft.Storage"
  ]
}
  • Azure Relay Subnet and setup
resource "azurerm_subnet" "relay_subnet" {
  name                                            = "snet-${local.resource_id}-${var.client}-rel"
  resource_group_name                             = azurerm_resource_group.rg.name
  virtual_network_name                            = azurerm_virtual_network.network.name
  address_prefixes                                = [var.relay_subnet]
  enforce_private_link_endpoint_network_policies  = true
  enforce_private_link_service_network_policies   = false
}

resource "azurerm_relay_namespace" "relay_namespace" {
  name                = "rel-${local.resource_id}-${var.client}-csh"
  location            = azurerm_resource_group.rg.location
  resource_group_name = azurerm_resource_group.rg.name
  sku_name = "Standard"
  tags = local.tags
}

resource "azurerm_network_profile" "cloud_shell_containers" {
  name                = "netpr-${local.resource_id}-${var.client}-csh"
  location            = azurerm_resource_group.rg.location
  resource_group_name = azurerm_resource_group.rg.name
  tags = local.tags
  container_network_interface {
    name = "eth-${azurerm_subnet.cloud_shell_subnet.name}"

    ip_configuration {
      name      = "ipconfig-${azurerm_subnet.cloud_shell_subnet.name}"
      subnet_id = azurerm_subnet.cloud_shell_subnet.id
    }
  }
}

resource "azurerm_private_endpoint" "relay_csh" {
  name                = "prve-${local.resource_id}-${var.client}-csh"
  location            = azurerm_resource_group.rg.location
  resource_group_name = azurerm_resource_group.rg.name
  tags                = local.tags

  subnet_id           = azurerm_subnet.relay_subnet.id
  private_service_connection {
    name                           = "prvsc-${local.resource_id}-${var.client}-csh"
    private_connection_resource_id = azurerm_relay_namespace.relay_namespace.id
    subresource_names              = ["namespace"]
    is_manual_connection           = false
  }
}

resource "azurerm_private_dns_zone" "private_dns_relay" {
  name                = "privatelink.servicebus.windows.net"
  resource_group_name = azurerm_resource_group.rg.name
  tags                = local.tags
}

resource "azurerm_private_dns_a_record" "relay_dns_a_record" {
  name                = "csh"
  zone_name           = azurerm_private_dns_zone.private_dns_relay.name
  resource_group_name = azurerm_resource_group.rg.name
  ttl                 = 3600
  records             = [azurerm_private_endpoint.relay_csh.private_service_connection[0].private_ip_address]
}

resource "azurerm_private_dns_zone_virtual_network_link" "relay_vnet_link" {
  name                  = "dnsvl-${local.resource_id}-${var.client}-csh"
  resource_group_name   = azurerm_resource_group.rg.name
  private_dns_zone_name = azurerm_private_dns_zone.private_dns_relay.name
  virtual_network_id    = azurerm_virtual_network.network.id
  registration_enabled  = false
}

Now connect to CloudShell

So the above should get you on the right track for the most secure and painless free maintenance Remote Access solution for Azure Cloud!

Goodbye VPN!
Goodbye Bastion Host!
Goodbye Jumpboxes!

CloudShell Vnet

Source: https://docs.microsoft.com/en-us/azure/cloud-shell/private-vnet

Adobe Experience Manager – Setup Azure Devops CICD

Overview

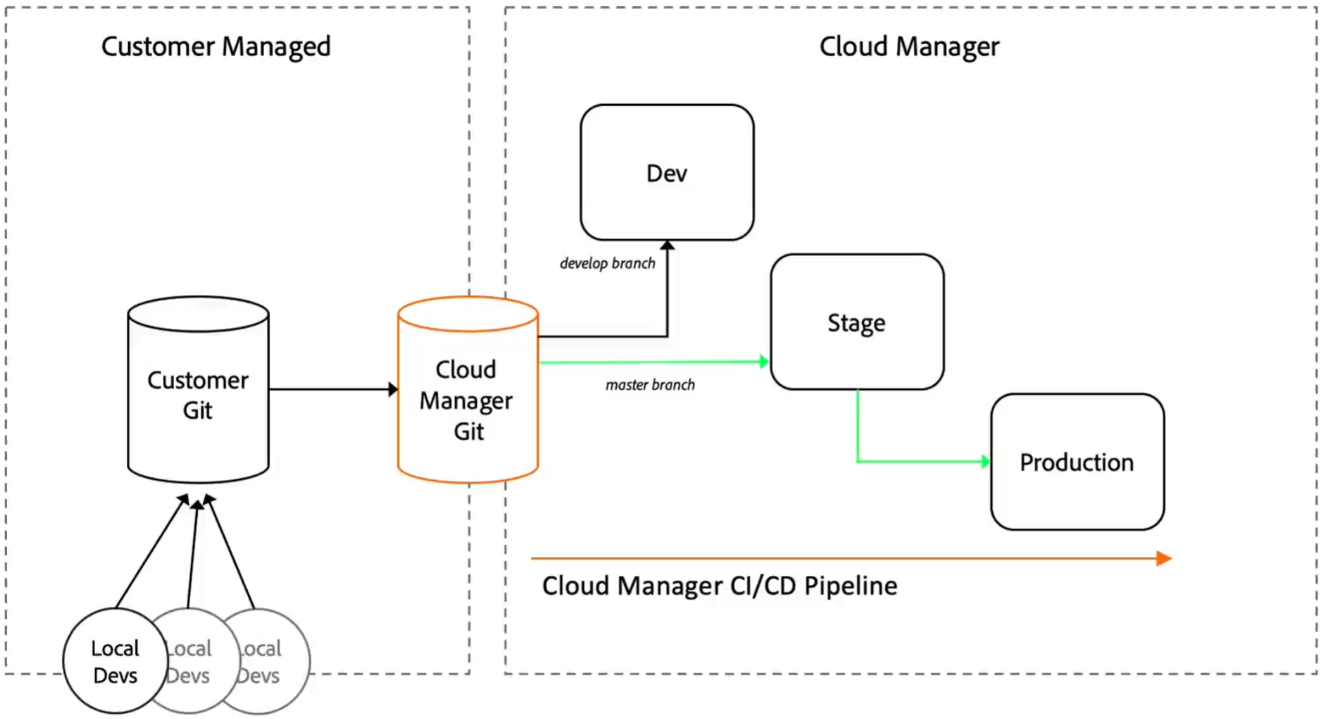
CI/CD Git Flow

Above we can see that we would like our developers to push to their own git repo (Customer Git = Azure Devops).

From here we can then Sync Azure git with AEM Cloud Manager Git.

Below is a sample build pipeline you can use in Azure Devops.

azure-pipline.yml

trigger:
  batch: true
  branches:
    include:
    - master

variables:
- name: remote_git
  value: rangerrom/africa-p46502-uk11112

stages:
- stage: AEM_Cloud_Manager
  jobs:
  - job: Push_To_Cloudmanager
    timeoutInMinutes: 10
    condition: succeeded()
    workspace:
      clean: all
    steps:
    #steps: [ script | bash | pwsh | powershell | checkout | task | templateReference ]
    
    - task: AzureKeyVault@1
      displayName: pull secrets
      inputs:
        azureSubscription: PROD
        KeyVaultName: mykeyvault
        SecretsFilter: aem_dm_cm_credentials
    - checkout: self
      clean: true
    - bash: echo "##vso[task.setvariable variable=git_ref]https://$(aem_dm_cm_credentials)@git.cloudmanager.adobe.com/$(remote_git)/"
      displayName: Set remote adobe git URL 
    - bash: git remote add adobe $(git_ref)
      displayName: Add git remote to Adobe CloudManager
    - bash: cat .git/config
      displayName: Show git config
    - bash: git checkout $(Build.SourceBranchName)
      displayName: Checkout $(Build.SourceBranchName) branch
    - bash: git push -f -v adobe $(Build.SourceBranchName)
      displayName: Push changes from $(Build.SourceBranchName) branch to Adobe CloudManager

That is pretty much the minimum required to sync the two git repos. Happy AEMing and building your CMS solution.

Kali Linux – Steam and Rocksmith 2014

I enjoy playing my bass guitar with Rocksmith. However I do not use Windows at all and wanted it to work with Kali Linux 2021.2, a Debian 10 Distro.

This is how I got it to work with my audio and Nvidia GeForce RTX 2070

Install crossover bin file

wget https://media.codeweavers.com/pub/crossover/cxlinux/demo/install-crossover-21.0.0.bin

chmod 755 install-crossover-21.0.0.bin

./install-crossover-21.0.0.bin

Activate critical 32 bit libraries so that 32 bit games run on 64 bit linux

sudo dpkg –add-architecture i386

sudo apt install nvidia-driver-libs:i386

In Crossover install steam

In Steam install rocksmith and Rocksmith 2014

Run cxdiag – works

Run cxdiag64 – works

Manual Fixes for 32 bit libraries so audio can work perfectly and other things like odbc etc

./cxfix missinglibgsm

./cxfix  missinglibasound

./cxfix missinglibpcap

./cxfix missinglibosmesa8

./cxfix missinglibopencl 

./cxfix missinglibodbc

./cxfix missinglibcapi20

./cxfix missinggstreamer1libav

Manual fix

apt-get install gstreamer1.0-plugins-bad:i386

Change audio to alsa

Winetricks – wget https://raw.githubusercontent.com/Winetricks/winetricks/master/src/winetricks

chmod +x winetricks

./winetricks

set audio to alsa

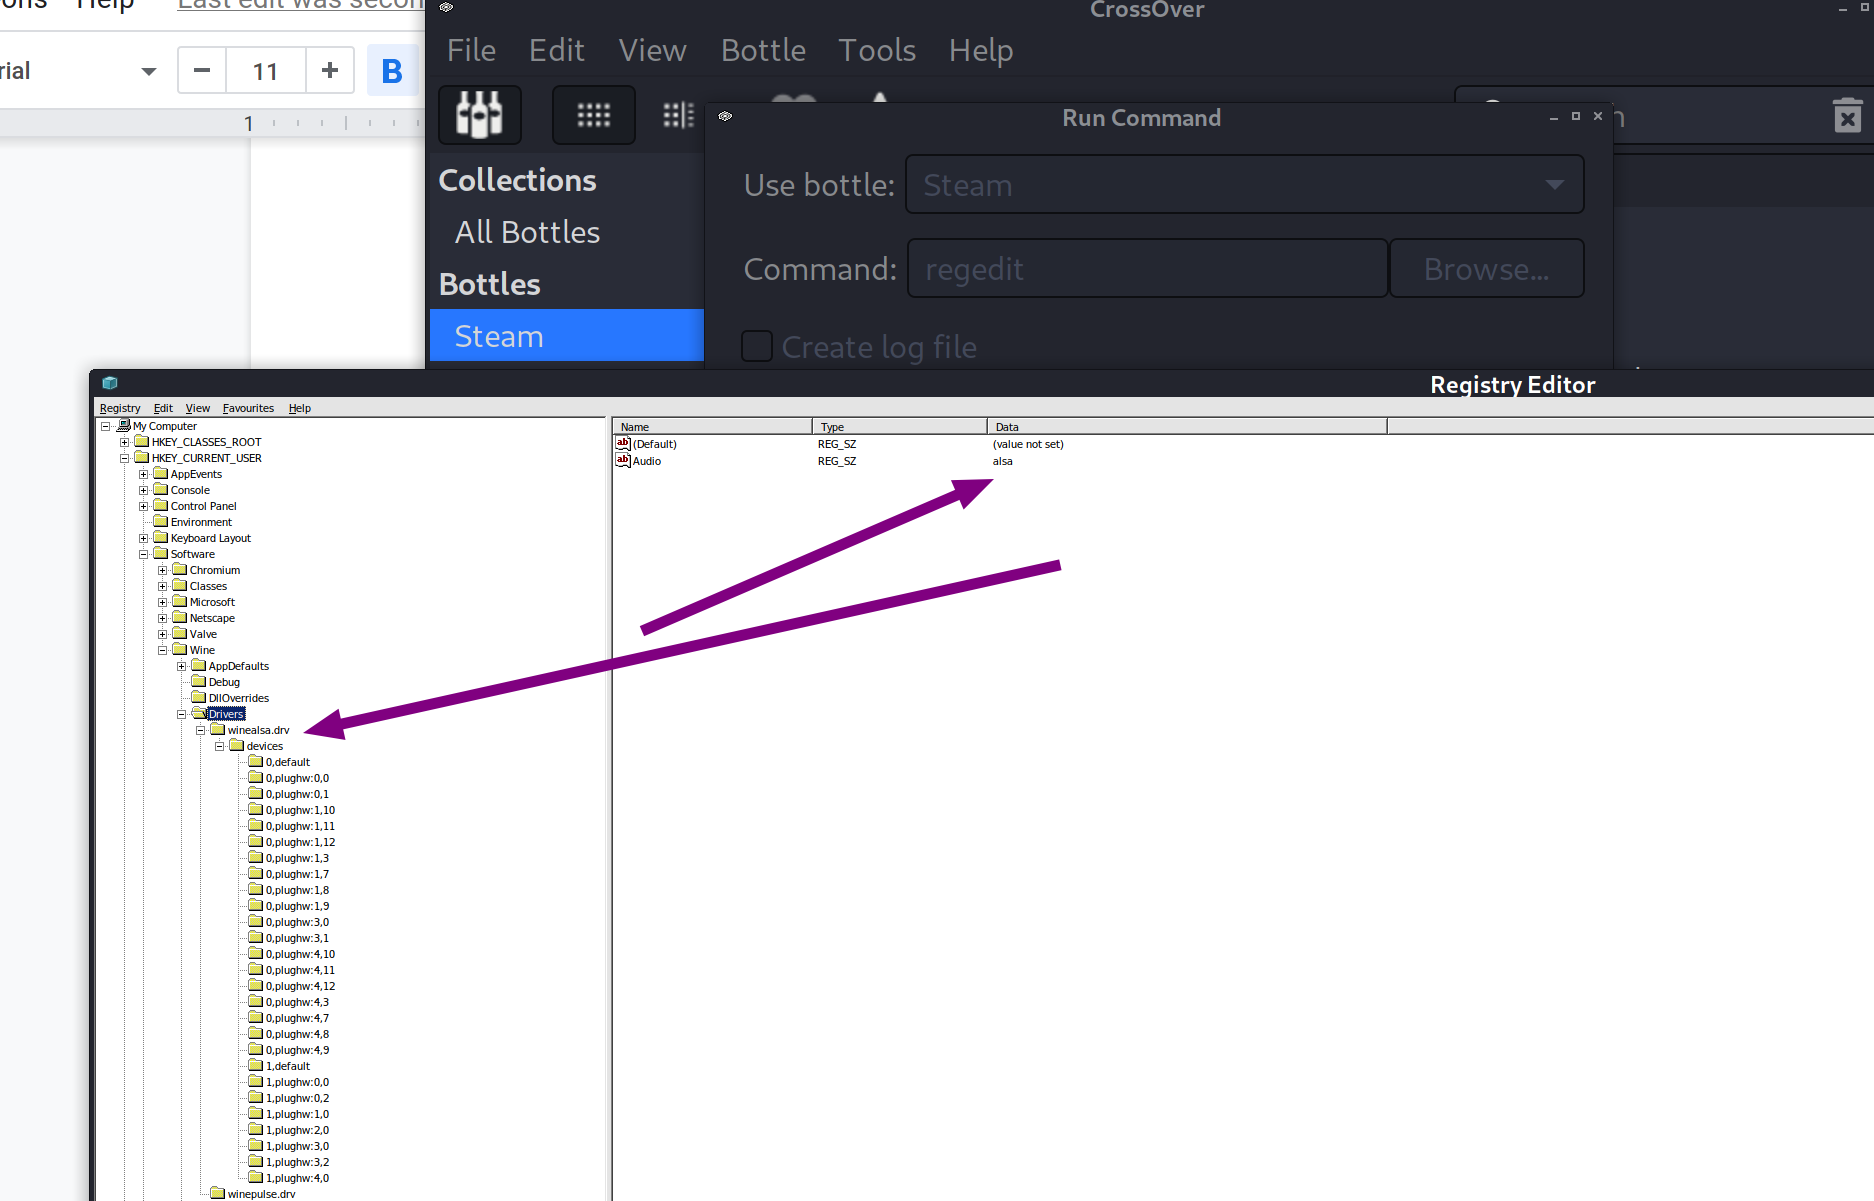
Run crossover regedit

Export CU/software/wine/drivers

Run bottle command regedit

Import registry file to bottle

Change driver to alsa

Rocksmith Config

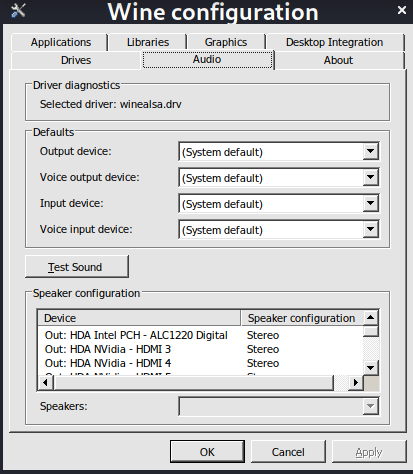
Now configure your steam bottle to use alsa audio drivers for Rocksmith to work.

~/cxoffice/bin/wine –bottle “Steam” winecfg

Configure Rocksmith INI

Win32UltraLowLatencyMode=0

Enjoy playing your guitar on linux with rocksmith!

Adobe Experience Manager – Remote SPA vs Headless

Adobe Experience Manager – Remote SPA vs Headless

It is important to consider the implications regarding the workflow content authors will use when publishing content to a website via

  • Headless
  • Remote SPA

Headless

API driven solution.

  • Author does not require a WYSIWYG experience when editing and updating a particular component
  • Re-usable, presentation-agnostic content, composed of structured data elements (text, dates, references, etc.
  • Implemented as a DAM asset
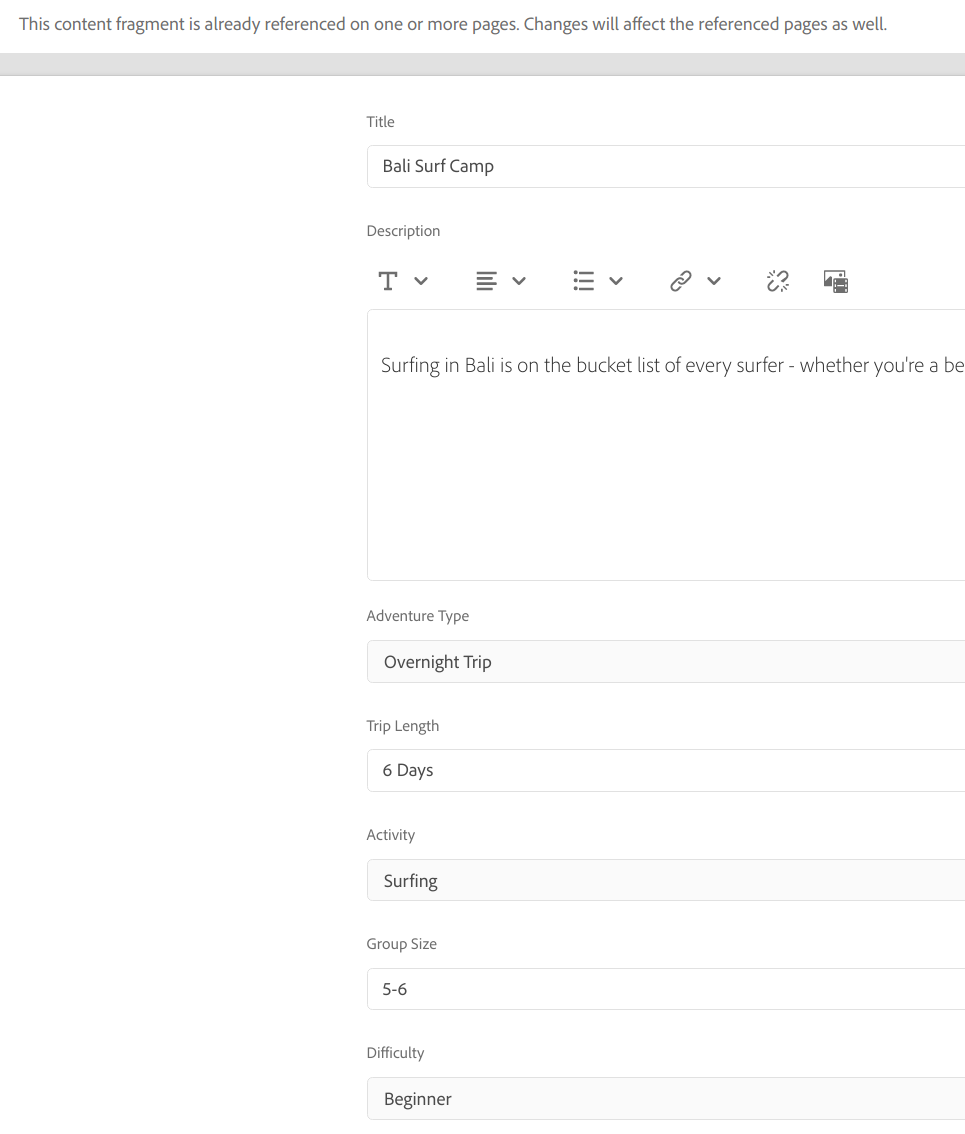
  • Used via the GraphQL Assets APIs for 3rd party consumption e.g. Trader

Content fragments drive the data model. Usually managed via AEM assets.

Remote SPA

A totally seperate website based on Angular/React/NextJS. Your site does not have to be a “true” remote spa, as long as it is leveraging the modern javascript based frameworks.

IFRAME in AEM author instance enables the wysiwyg expereince.

Usually managed via AEM Sites

Developer activates areas of a website for content authors to use AEM components

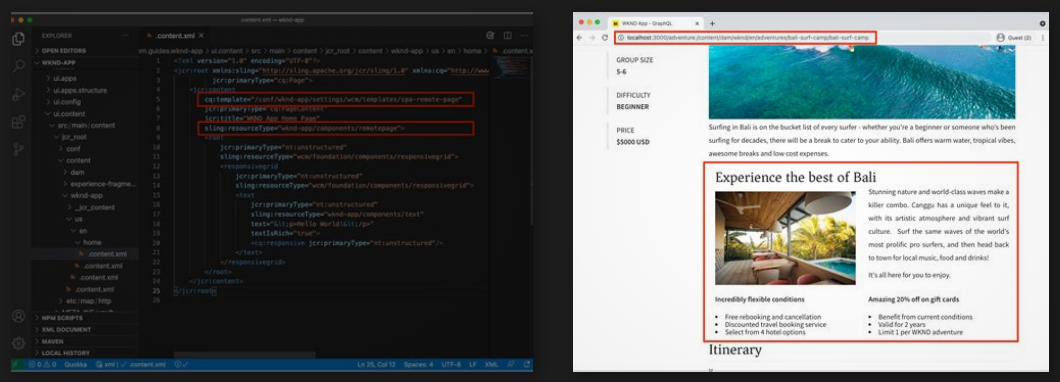
This is the high level architecture to allow AEM to integrate with an existing angular site.

A great tutorial to work through regarding remote spa is https://experienceleague.adobe.com/docs/experience-manager-learn/getting-started-with-aem-headless/spa-editor/remote-spa/quick-setup.html?lang=en

Remote SPA Iframe Model

1. SPA Editor loads.
2. SPA is loaded in a separated frame.
3. SPA requests JSON content and renders components client-side.
4. SPA Editor detects rendered components and generates overlays.
5. Author clicks overlay, displaying the component’s edit toolbar.
6. SPA Editor persists edits with a POST request to the server.
7. SPA Editor requests updated JSON to the SPA Editor, which is sent to the SPA with a DOM Event.
8. SPA re-renders the concerned component, updating its DOM.

Advantages

The content author will not experience any difference when editing or creating content.

Enables in context editing of content & configuring components.

Enables in context layout management of components.

Provides the content authors with same user experience both in author and publish mode.

It supports React and Angular framework which are widely used to create SPAs.

Much improved seamless user experience.

Improved application performance, as all content is retrieved once in a single page load with additional resources loaded asynchronously as needed based on user interaction with in the page.

Clear separation of front end and back end development which reduces the integration dependency on each other.

Gives the front-end developers the flexibility to use their choice of JavaScript frameworks and build tools to create highly interactive applications.

By being faster, fluid, and more like a native application, a SPA becomes a very attractive experience not only for the visitor of the webpage, but also for marketers and developers due to the nature of how SPAs work.
Kubernetes – Prometheus –  use an existing persistent volume claim

Kubernetes – Prometheus – use an existing persistent volume claim

We use the Prometheus Operator Chart to deploy the Prometheus, Alert Manager and Grafana stack,

Please note as of October 2020, the official Prometheus Operator Chart is.

prometheus-communityhttps://prometheus-community.github.io/helm-charts

To add this chart to your Helm repo.

helm repo add prometheus-community https://prometheus-community.github.io/helm-charts

What usually happens is that you will initially install the chart and by default your kubernetes PV will have a default policy of DELETE. This means if you uninstall the chart, the Persistent Volume in the cloud (Azure, AWS, GCP etc) will also be deleted. Not a great outcome if you want historic metrics.

What you want is a PV that has a reclaim policy of retain, so that when the chart is every uninstalled, your managed disks in the cloud are retained.

So how do you go about doing this?

  • Install the chart initially with a persistent volume configured in the values files for Prometheus. (The default way)
  • Configure Grafana correctly on the first install.

Stage 1

Prometheus

We using managed GKE/GCP, so standard storage class is fine, your cloud provider may be different.

  • Configure your Prometheus Operator chart with the following in the values file.
prometheus:    
    prometheusSpec:
      storageSpec:
        volumeClaimTemplate:
          spec:
            storageClassName: standard
            resources:
              requests:
                storage: 64Gi

Grafana

With Grafana, you can get away with setting it up correctly first time round.

Create the PVC

apiVersion: v1
kind: PersistentVolumeClaim
metadata:
  name: grafana
spec:
  accessModes:
    - ReadWriteOnce
  resources:
    requests:
      storage: 10Gi

Add the following to the Grafana values files.

grafana:
  persistence:
    enabled: true
    type: pvc
    existingClaim: pv-claim-grafana
  • Deploy your chart

Stage 2

Once the chart is deployed, go to your cloud provider and note the disk id’s. I am using GCP. So I note them down here:

In the above, the Name column is the disk id for GCP. Azure/AWS will be different e.g. Disk URI etc.

Go back to your helm chart repository and lets alter the chart so that Prometheus and Grafana are always bound to this disks, even if you uninstall the chart.

Prometheus

If you would like to keep the data of the current persistent volumes, it should be possible to attach existing volumes to new PVCs and PVs that are created using the conventions in the new chart. For example, in order to use an existing Azure disk for a helm release called `prometheus-operator` the following resources can be created:

  • Note down the RELEASE NAME of your prometheus operator chart. Mine is called prometheus operator.

Configure the following yaml template. This is a HACK. By making the name of the PV and PVC EXACTLY the same as the chart. Prometheus will reuse the PV/PVC.

apiVersion: v1
kind: PersistentVolume
metadata:
  name: pvc-prometheus-operator-prometheus-0
spec:
  storageClassName: "standard"
  capacity:
    storage: 64Gi
  accessModes:
    - ReadWriteOnce
  gcePersistentDisk:
    pdName: gke-dev-xyz-aae-pvc-d8971937-85f8-4566-b90e-110dfbc17cbb
    fsType: ext4
---
apiVersion: v1
kind: PersistentVolumeClaim
metadata:
  labels:
    app: prometheus
    prometheus: prometheus-operator-prometheus
  name:  prometheus-prometheus-operator-prometheus-db-prometheus-prometheus-operator-prometheus-0
spec:
  storageClassName: "standard"
  accessModes:
    - ReadWriteOnce
  resources:
    requests:
      storage: 64Gi
  • Configure the above to always run as a PreInstall hook e.g. with Helmfile
  - events: ["presync"]
    showlogs: true
    command: "kubectl"
    args:
    - apply
    - -n
    - monitoring
    - -f
    - ./pv/pv-prometheus.yaml

Grafana

Grafana is not so fussy. So we can do the following:

Configure the following yaml template.

apiVersion: v1
kind: PersistentVolume
metadata:
  name: pv-grafana
spec:
  storageClassName: "standard"
  capacity:
    storage: 10Gi
  accessModes:
    - ReadWriteOnce
  claimRef:
    namespace: service-compliance
    name: pv-claim-grafana
  gcePersistentDisk:
    pdName: gke-dev-xyz-aae-pvc-4b450590-8ec0-471d-bf1a-4f6aaa9c4e81
    fsType: ext4
---
apiVersion: v1
kind: PersistentVolumeClaim
metadata:
  name: pv-claim-grafana
spec:
  storageClassName: "standard"
  accessModes:
    - ReadWriteOnce
  resources:
    requests:
      storage: 10Gi

Then finally setup a preinstall helm sync if using helmfile

  hooks:
  - events: ["presync"]
    showlogs: true
    command: "kubectl"
    args:
    - apply
    - -n
    - monitoring
    - -f
    - ./pv/pv-grafana.yaml

With the above in place, you will be able to rerun chart installs for updates and uninstall the chart. Your final check is to ensure the PVs are RETAIN and not on the DELETE policy.

Using Kubernetes to measure homepage speed index

Hi,

We decided to try out using a Kubernetes cronjob to measure the SPEED INDEX score of a system. We thought this would be a great idea. We can have a job that polls a server and measures the performance of the HomePage loading.

We use Cypress and a lighthouse plugin for synthetics.
https://github.com/mfrachet/cypress-audit

Why Speed Index and not something like BrowserTimings?

Speed index measures the time it takes for the visible (above-the-fold) parts of a webpage to appear to the users. It became part of the WebPageTest in April 2012. The Lighthouse-powered Audits panel in the Chrome DevTools also measures it.

Speed index can be used to compare performance against competitors or previous versions of the same website. It best utilised alongside other metrics like load time and start-render to get a better understanding of a site’s quality.

Thats pretty awesome. You get a good metric that shows you the user experience. BrowserTimings usually do not factor in when the user can interact with the page. Even if a web page takes 10 seconds to load, if it is usable within 4 seconds, we good as gold.

The Problem

SpeedIndex uses your browser and it requires CPU/Memory, both of which can be throttled by kubernetes.

We noticed that when we used a normal machine the speed index was good – around 5 seconds. We noticed in kubernetes it would be around 12 seconds!

We had set some throttling limits, but never though it would get throttled.

resources:
              limits:
                cpu: 1500m
                memory: 1500M
              requests:
                cpu: "1"
                memory: 1G

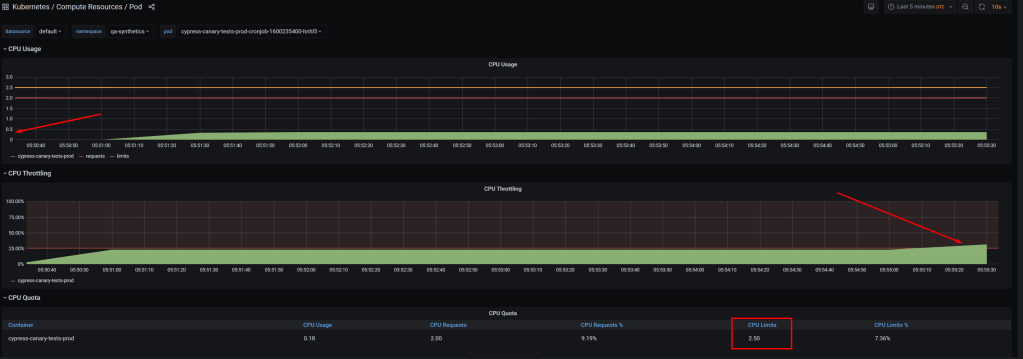
However, it was getting throttled!

We decided to remove the resource limits

resources:
 {}

Now, there is no throttling and the speed index measured similar to our home device.

The above graph shows that throttling disabled improved the metric.

Conclusion

Even those Speed Index is a great way to measure performance, we cannot use it on Kubernetes as a measuring device, because even with throttling off, you just never know if another container/pod is stealing resources. The best way forward when measuring metrics (NOT GATHERING), is to measure as close as possible to the source e.g. Client Side Javascript etc.

So for us, it is back to the drawing board and pick a measurement as close to the client as possible.

Possible solutions:

https://github.com/WPO-Foundation/RUM-SpeedIndex/blob/master/src/rum-speedindex.js

Avoid using kubernetes to be a measuring device that measures metrics related to CPU/Memory

Questions

There seems to be a bug in Kubernetes with some linux kernels regarding CFS/Throttling

https://github.com/kubernetes/kubernetes/issues/67577

What still puzzles me, is I have a physical node that is not using power. I have a process using 0.4 cpu with a limit of 2.5 cpus and it gets throttled!

This is on Azure Kubernetes 1.16. However I can reproduce the issue on Google GKE as well. So it is a kubernetes algorithm of some sort that limits more than you would expect!